
In certain regions of the orbit and during certain planned operations, interference from other instruments and/or spacecraft systems affects the WBD measurements. At these times one must use caution so as not to misinterpret the WBD data. In addition certain design features of the WBD hardware and software and of the electric antenna that is used by WBD make the WBD instrument 1) vulnerable to nonlinear effects in the form of harmonic generation under certain environmental conditions and 2) susceptible to distorting waveforms when measuring specific types of waves, most notably solitary waves in the form of pulses. In these cases, extreme caution must be used when analyzing the data. The remainder of this page will be devoted to a description of the various known interferences and instrumental effects with examples of how they are manifested in the WBD data. For information on known problems with the WBD data set, the user is referred to the WBD Caveats document, which is available on the WBD website (https://space.physics.uiowa.edu/plasma-wave/cluster/) and at the Cluster and Double Star Science Archive (CSA) (https://www.cosmos.esa.int/web/csa/access). If you need further information on those problems, or the interpretation issues discussed below, please contact Jolene Pickett, Principal Investigator, at: pickett@uiowa.edu.
Electron Drift Instrument (EDI)
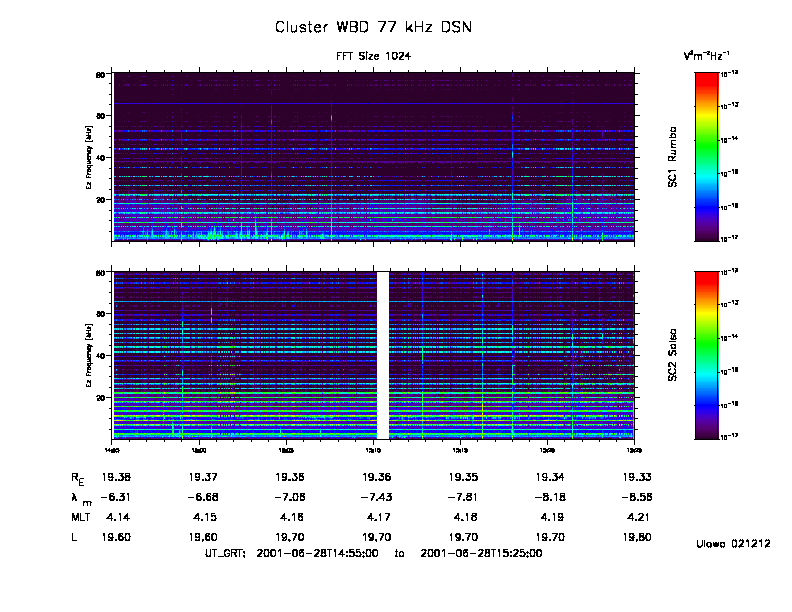
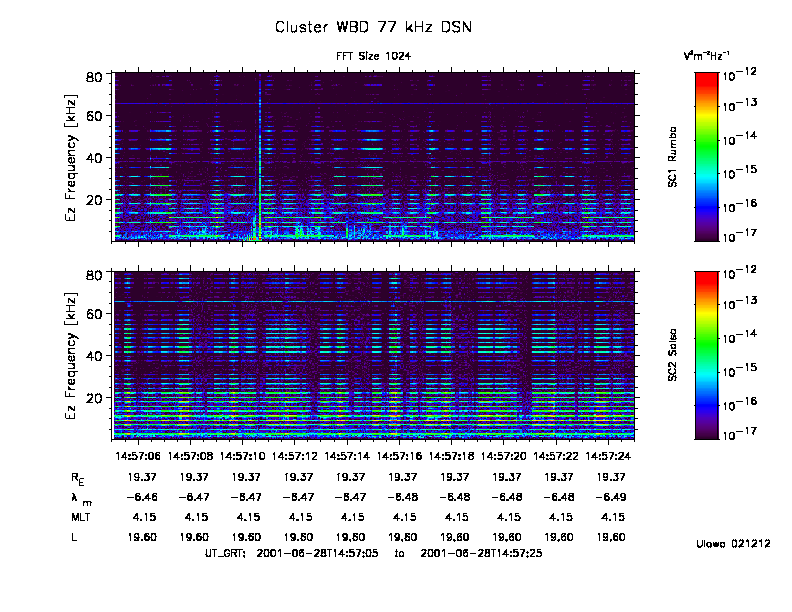
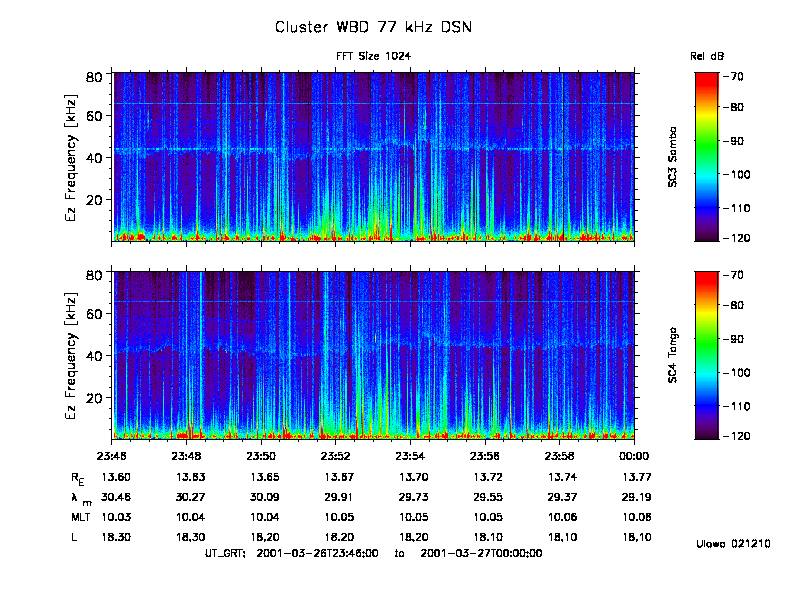
The purpose of the Electron Drift Instrument (EDI) is to measure the strength of electric and magnetic fields in the vicinity of the Cluster spacecraft. This is done by firing two weak beams of electrons into the space around each spacecraft and receiving them on the opposite side of the spacecraft from which each was fired. Figures 1 and 2 below show how active operation of EDI affects WBD measurements. Both of these calibrated spectrograms reveal EDI's operation as horizontal lines of interference. On this date EDI was running in high current mode, making it easily detectable by the electric antennas. Figure 1 shows what EDI's interference looks like on a half hour time scale. When viewed on a smaller time scale, it becomes apparent that the signals produced by EDI pulsate in intensity as is clearly shown in Figure 2. This periodicity in the intensity is due to the Windshield-Wiper (WW) Mode EDI was running this day. In the WW-mode EDI sweeps its two weak beams of electrons rapidly back and forth through a range of angles; hence the name 'windshield-wiper'. Over time the paths the two beams of electrons take around the spacecraft change due to the different angles they are swept through upon leaving the spacecraft by EDI's two electron guns. This propagation in the paths that the electron beams take is detected by the electric antennas as varying intensities in the electric field. Interference from EDI on spacecraft 4 will never be seen because this instrument was never operational, and spacecraft 2 produces unusually intense interference due to a malfunction. Starting January 24, 2010, the EDI team decided not to operate EDI in this active mode on any spacecraft during WBD operations, so EDI interference is not expected after that date but might be present infrequently for specially planned operations or through faulty commanding.
Figures 1 and 2 also show a more constant line of intensity at roughly 65.75 kHz. This is the fundamental mode created by the interference associated with the electrical circuits of the spacecrafts' batteries (see discussion of this in the section below entitled "Spacecraft Battery Interference").
Receiver Gain Effects for Wide Band Data Instrument (WBD)
In November of 2002 it was discovered that automatic gain changes in the WBD receiver were causing impulses to be seen in electric and magnetic field data. Figure 3 shows what these impulses look like in a line plot of the raw count data versus time and Figure 4 is a calibrated spectrogram for the same time period. Examination of Figure 3 shows that there are two kinds of impulses. The first of these two (e.g., at ~ 0.55 seconds after start in panel 1 of Figure 3) causes the data to spike and clip in the positive direction (a raw count of 255). The other impulse (eg., at ~ 1.18 seconds after start in panel 1 of Figure 3) is a reflection of the first about the horizontal axis. Thus this one clips in the negative direction (a raw count of 0). Only specific changes in the receiver's gain cause these two impulses. The positively clipped impulse is only seen when the gain is changed from 35 dB to 40 dB and 50 dB to 45 dB. The negatively clipped impulse is seen at a gain change from 45 dB to 50 dB. These are the only times such impulses are seen, and, when such gain changes are made, these impulses will always be present in the data. The time it takes these impulses to damp out is roughly one tenth of a second.
Correlations between Figures 3 and 4 are easily seen thus identifying the impulses in a spectrogram. The line plot for spacecraft 1 reveals a positively clipped impulse occurring at approximately 9:29:19.55 and a negatively clipped impulse developing just before 9:29:20.20. Inspection of Figure 4 for spacecraft 1 at these same times shows a disturbance in the spectrogram being one pixel wide that covers the entire bandwidth. The disturbances appear as thin columns that start out red (greatest intensity) at the base frequency and span the visible spectrum to green towards the upper bound of the bandwidth. Similar correlations amongst Figure 3 and Figure 4 can be made for spacecrafts 2, 3 and 4.
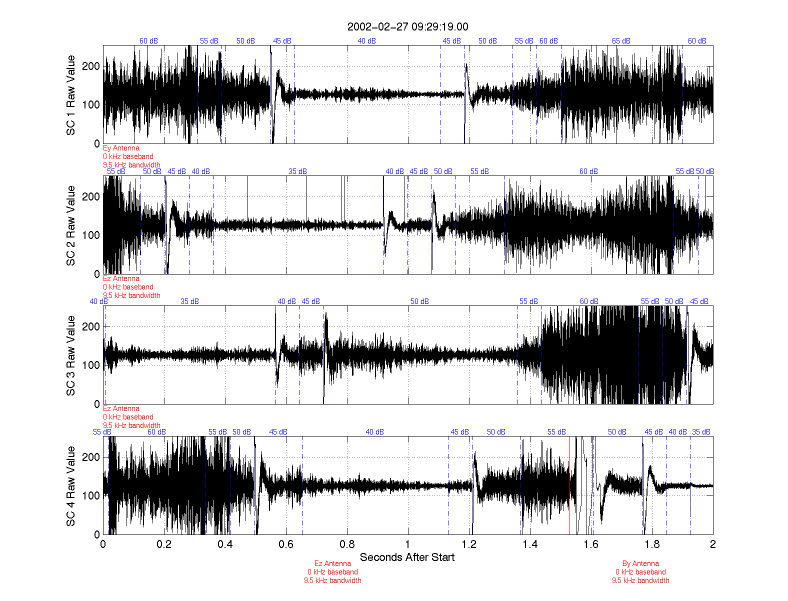
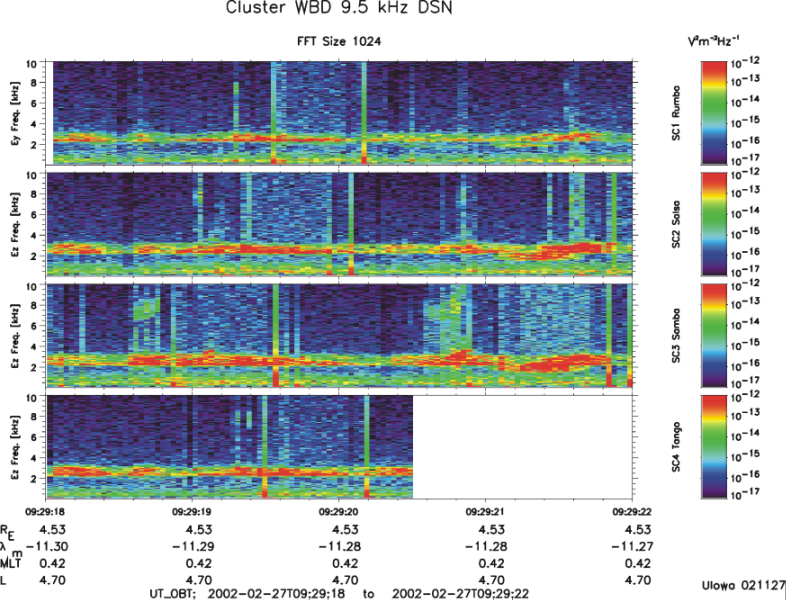
The reason that data appear to be missing for spacecraft 4 in Figure 4 is because a change from an electric antenna to a magnetic search coil was made at approximately 9:29:20.5. This can be seen in Figure 3 where sensor information is given in red. Figure 3 also shows clipped data following this switch for a duration of approximately a tenth of a second. The clipped data over this tenth of a second are not associated with changes in the receiver's gain even though the waveform somewhat resembles the impulses previously discussed.
Spacecraft Battery Interference
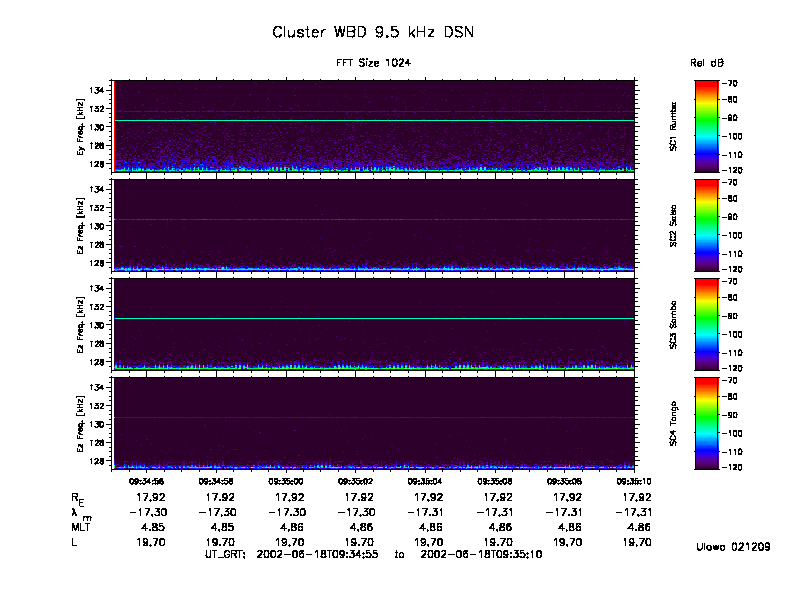
Power for the four Cluster spacecraft during eclipses and periods of peak power demand is supplied in part by five silver/cadmium batteries onboard each of the four spacecraft. It has been determined that the electrical circuits connected to these batteries create an interference in the data whose fundamental mode is approximately 65.75 kHz. Figure 5 shows this first harmonic created by the batteries onboard spacecraft 3 and 4 as a narrow horizontal line (constant frequency) residing around 65.75 kHz. Other modes in the harmonic series for this interference are readily seen in data taken from other days. For example, when WBD was set to an input frequency range of 9.5 kHz with a frequency conversion of 125 kHz on June 18, 2002, the second harmonic created by the batteries onboard spacecraft 1 was seen at a frequency of roughly 131.5 kHz in the calibrated spectrogram for this spacecraft (see Figure 6).
Spacecraft Power Bus Interference
A line of greater intensity at approximately 130.6 kHz has been repeatedly seen in the WBD data. It has been determined that this is the fundamental mode of oscillation created by the spacecraft power bus on all four cluster spacecraft. Figure 6 shows this first harmonic created by the spacecraft power bus in a calibrated spectrogram of the data collected when the wide-band receiver had an input frequency range of 9.5 kHz with a frequency conversion of 125 kHz. As expected, this fundamental mode of 130.6 kHz is the first of a harmonic series for this oscillation created by the spacecraft power bus. When the wide-band receiver has been set with an input frequency range of 19 kHz and a frequency conversion of 250 kHz, the second harmonic created by the power bus is seen at a frequency of roughly 261.2 kHz. An example of this can be seen in the data for August 7, 2002 (not shown here). Likewise, the fourth harmonic of 522.4 kHz can be seen when the wide-band receiver is set to an input frequency range of 77 kHz with a frequency conversion of 500 kHz. An example of this can be seen in the data for May 25, 2001 (not shown here).
It is worth noting that the intensity of the interference is less on spacecraft 2 and 4 than it is on spacecraft 1 and 3. More effort was put into rejecting this interference on these two spacecraft prior to launch, with time constraints preventing the same effort for the other two spacecraft.
In Figure 6 a fainter line at roughly 131.5 kHz can be seen for spacecraft 1. This is the second harmonic of the fundamental mode created by the interference associated with the electrical circuits of the spacecraft's batteries as described in the previous section.
WHISPER Sounder Instrument Interference
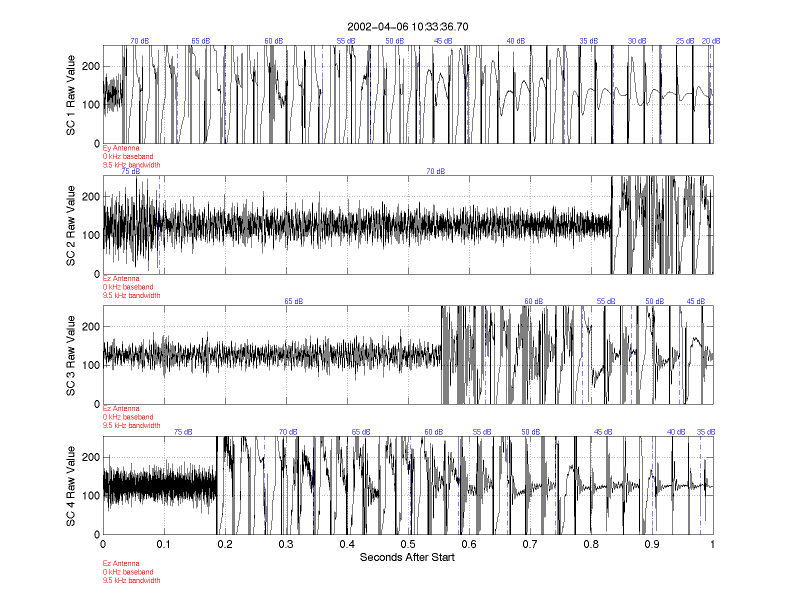
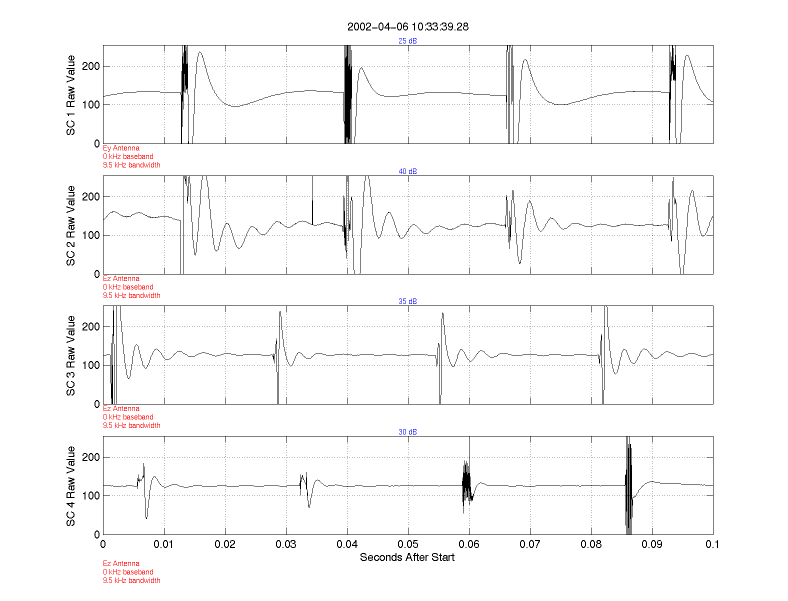
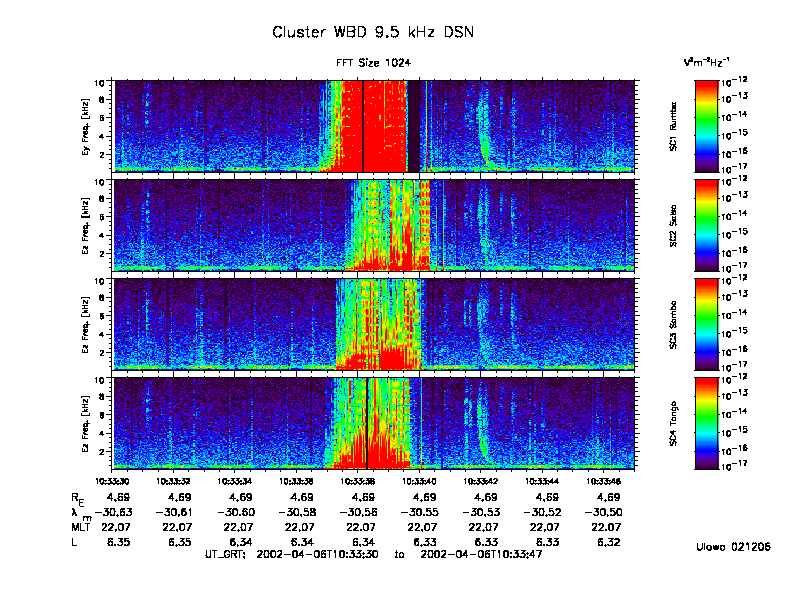
WBD data clearly show when active sounding of WHISPER is taking place as seen in Figures 7 and 8 below. Figure 7 reveals that the sounding looks like consecutive impulses in a line plot of the raw count data versus time. It is plainly seen in Figure 7 that active sounding begins at approximately 10:33:36.73 for spacecraft 1, 10:33:37.53 for spacecraft 2, 10:33:37.25 for spacecraft 3, and 10:33:36.88 for spacecraft 4. Figure 8 has a smaller time domain to provide a closer look at the pulses transmitted by the WHISPER sounder. The pulses seem to occur every 26.6 milliseconds, which is one of the step duration settings for the WHISPER sounder. The step duration can also be set at 13.3, 40, 66.6, 106.6, 125, and 250 milliseconds. In all cases, the pulse emitted by the sounder has a time duration of 0.5 to 1 milliseconds.
Figure 9 shows that the sounding appears as a column of greater intensity spanning the entire bandwidth in a calibrated spectrogram. This figure also shows that the sounding lasts for three seconds on all four spacecraft. The sounding appears to have the greatest intensity for spacecraft 1. The reason for this is because the transmitter for WHISPER is connected to the shields of the Ey antenna, which happens to be the antenna used by spacecraft 1 in Figure 9. Because one of the two probes of the Ez antenna on each of spacecraft 1, 2 and 3 failed, all WBD operations on spacecraft 1 starting January 10, 2002, on spacecraft 2 starting July 8, 2007, and on spacecraft 3 starting August 6, 2002 were carried out using the Ey antenna. Thus, the active Whisper soundings that are always run using the Ey antenna of all spacecraft will almost always appear more intense in the WBD data on spacecraft 1, 2 and 3. However, since probe 4 on the Ey antenna failed on spacecraft 1 in November 2009, WBD switched back to using the Ez antenna on that spacecraft so the soundings should be less intense on that spacecraft once again. The consequence of using this antenna is that the noise floor is greatly raised since it is now half of its original length, using the one good probe 2 and the spacecraft body as the other probe (for more detail on this, see the last section on "High Noise Floor".
900 Hz Clock Effects for the Digital Wave Processor (DWP)
The DWP 900 Hz clock on all four Cluster spacecraft provides onboard timing allowing for correlation studies between the four spacecraft. Figure 10 shows two interference lines in the WBD magnetic field data for all four Cluster spacecraft. The first resides at a frequency of 900 Hz, which is the fundamental mode produced by the onboard clock. The second interference line is the second harmonic which has a value of 1.8 kHz. This interference produced by the clock is only seen in the magnetic field data.
Interference from Electric Field Antennas
Figure 11 below shows periodic electrical interference patterns picked up by all four Cluster spacecraft on April 6, 2002. All four spacecraft were in the southern nightside magnetosphere at high latitude at the time these data were collected. These interference patterns appear to have a periodicity on the order of two seconds, which is roughly half a spin period for the spacecraft.
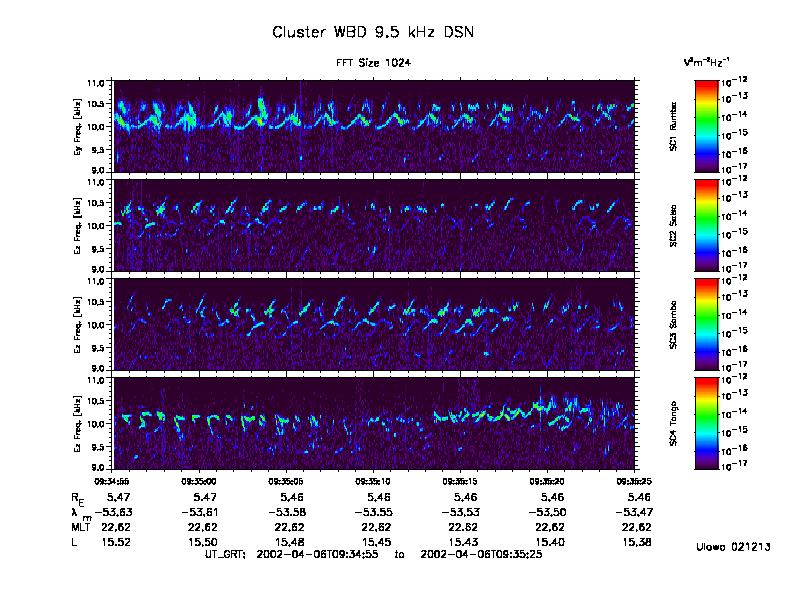
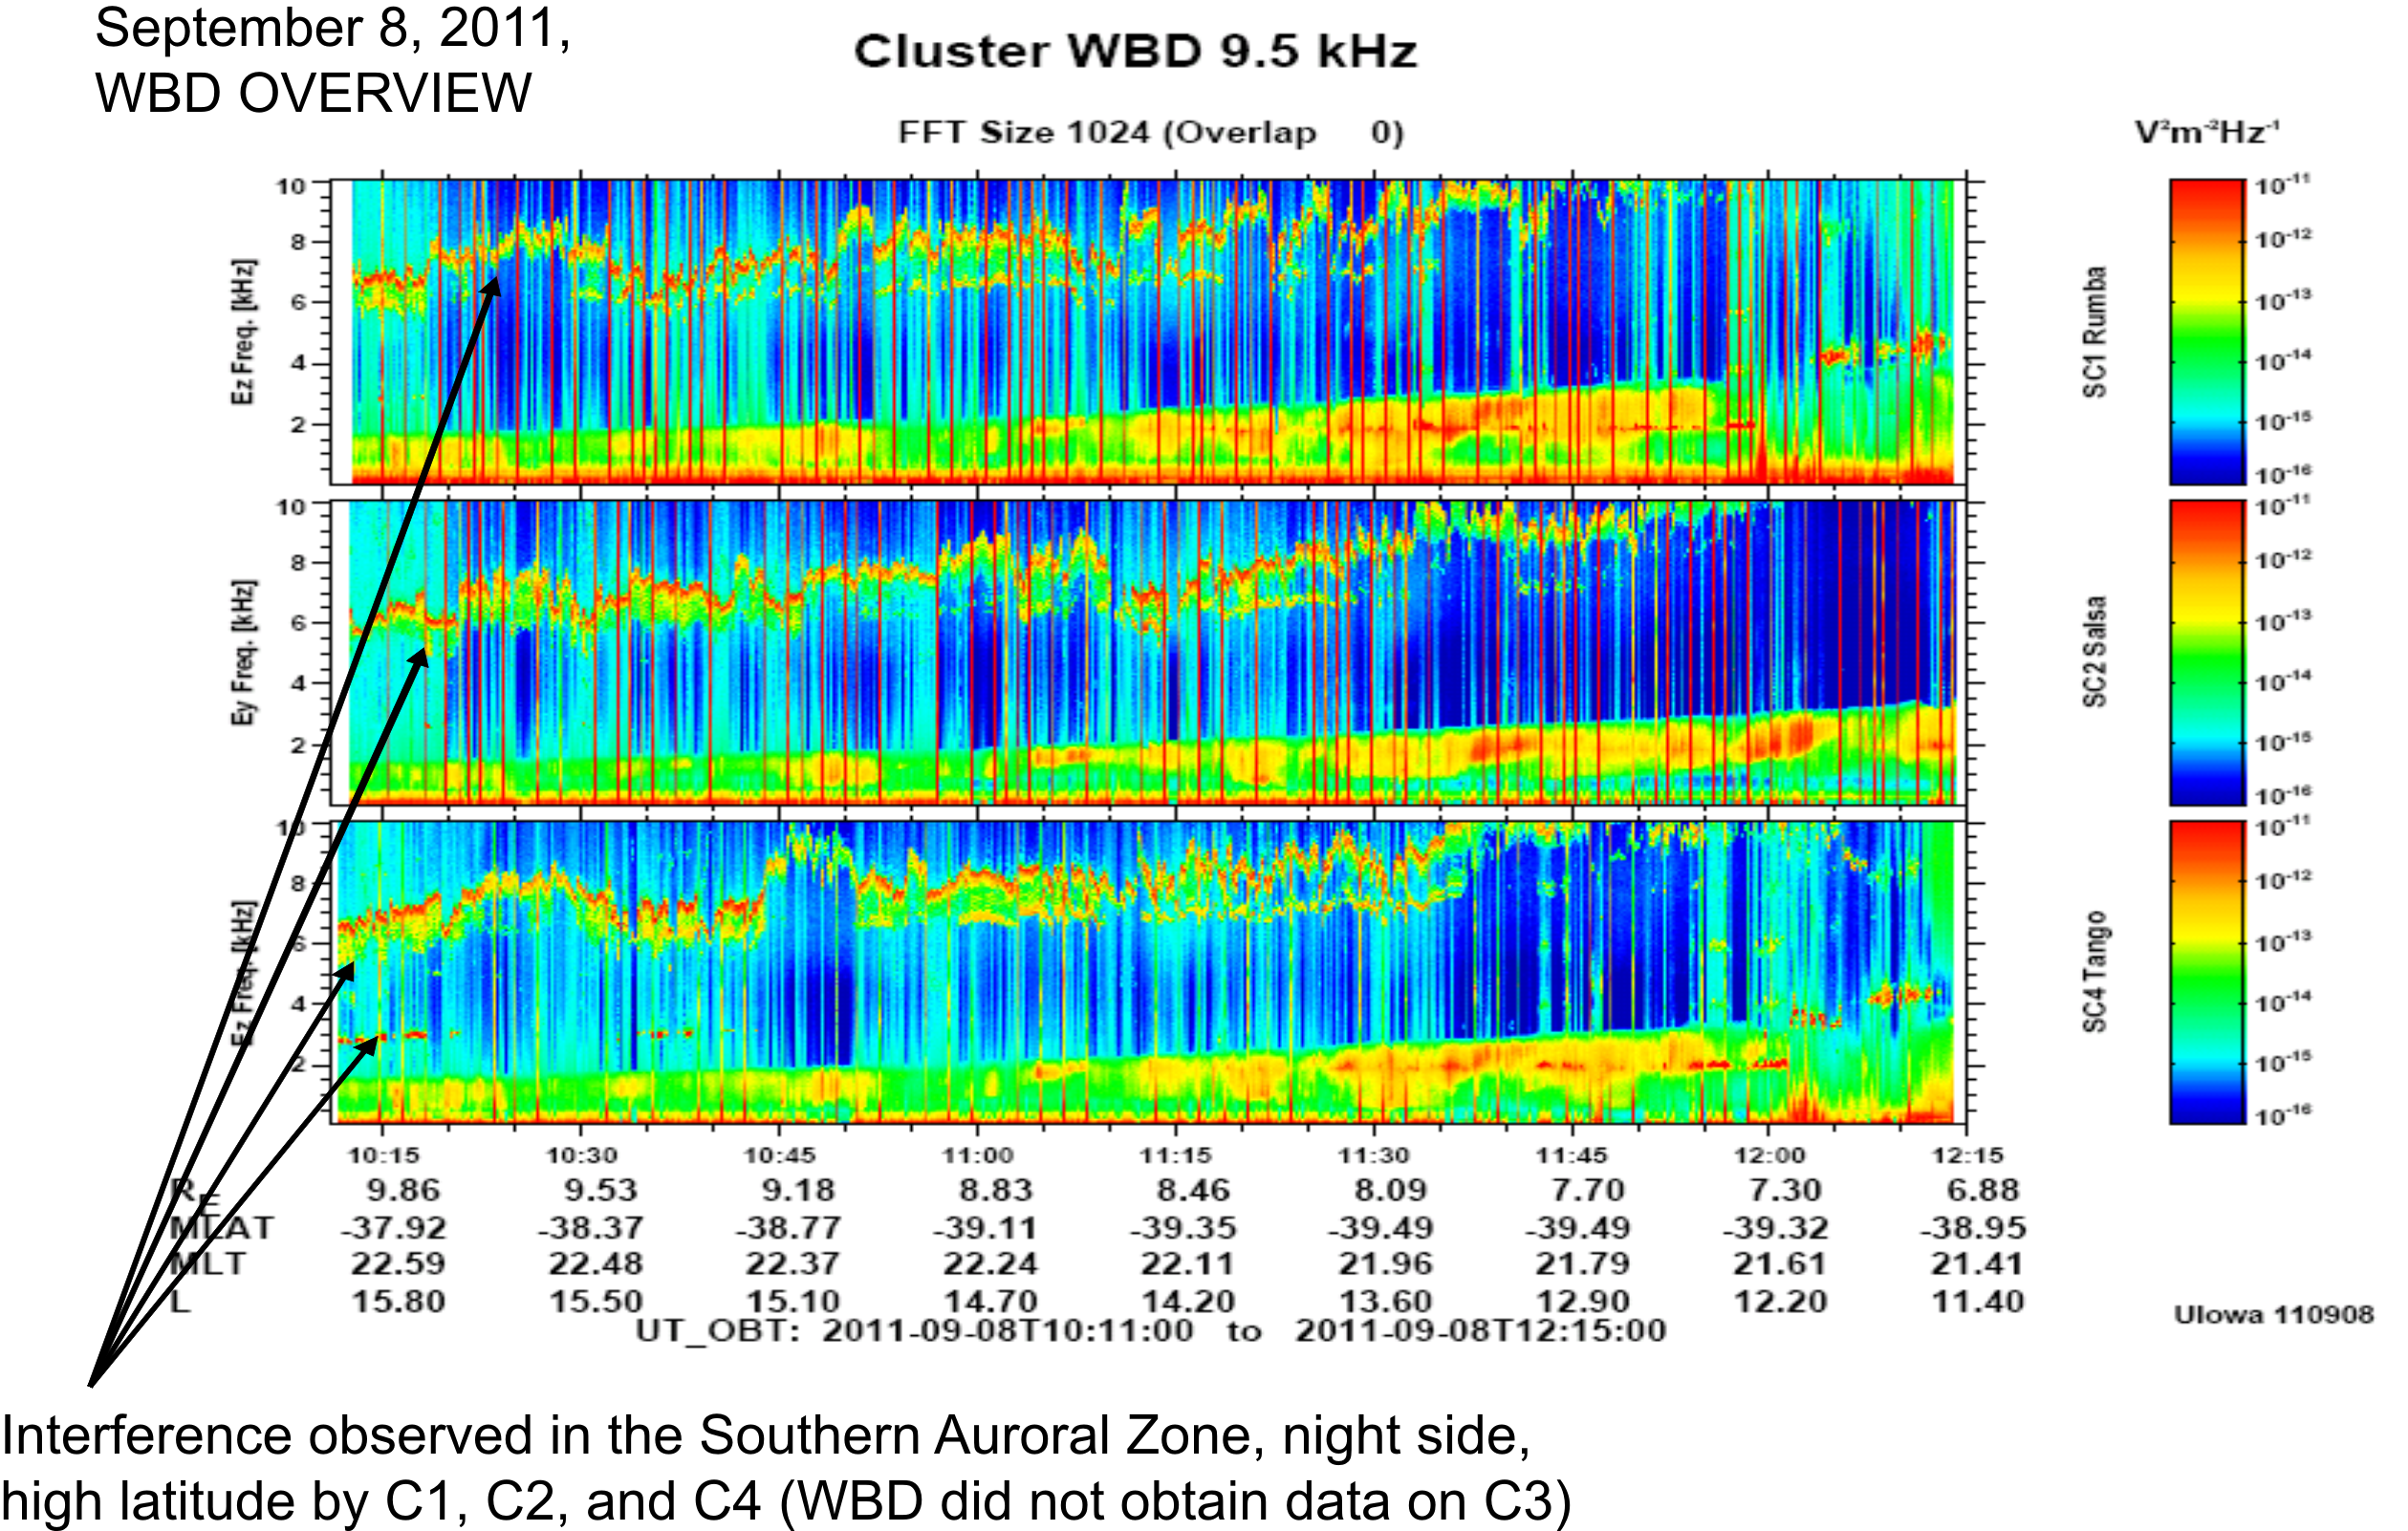
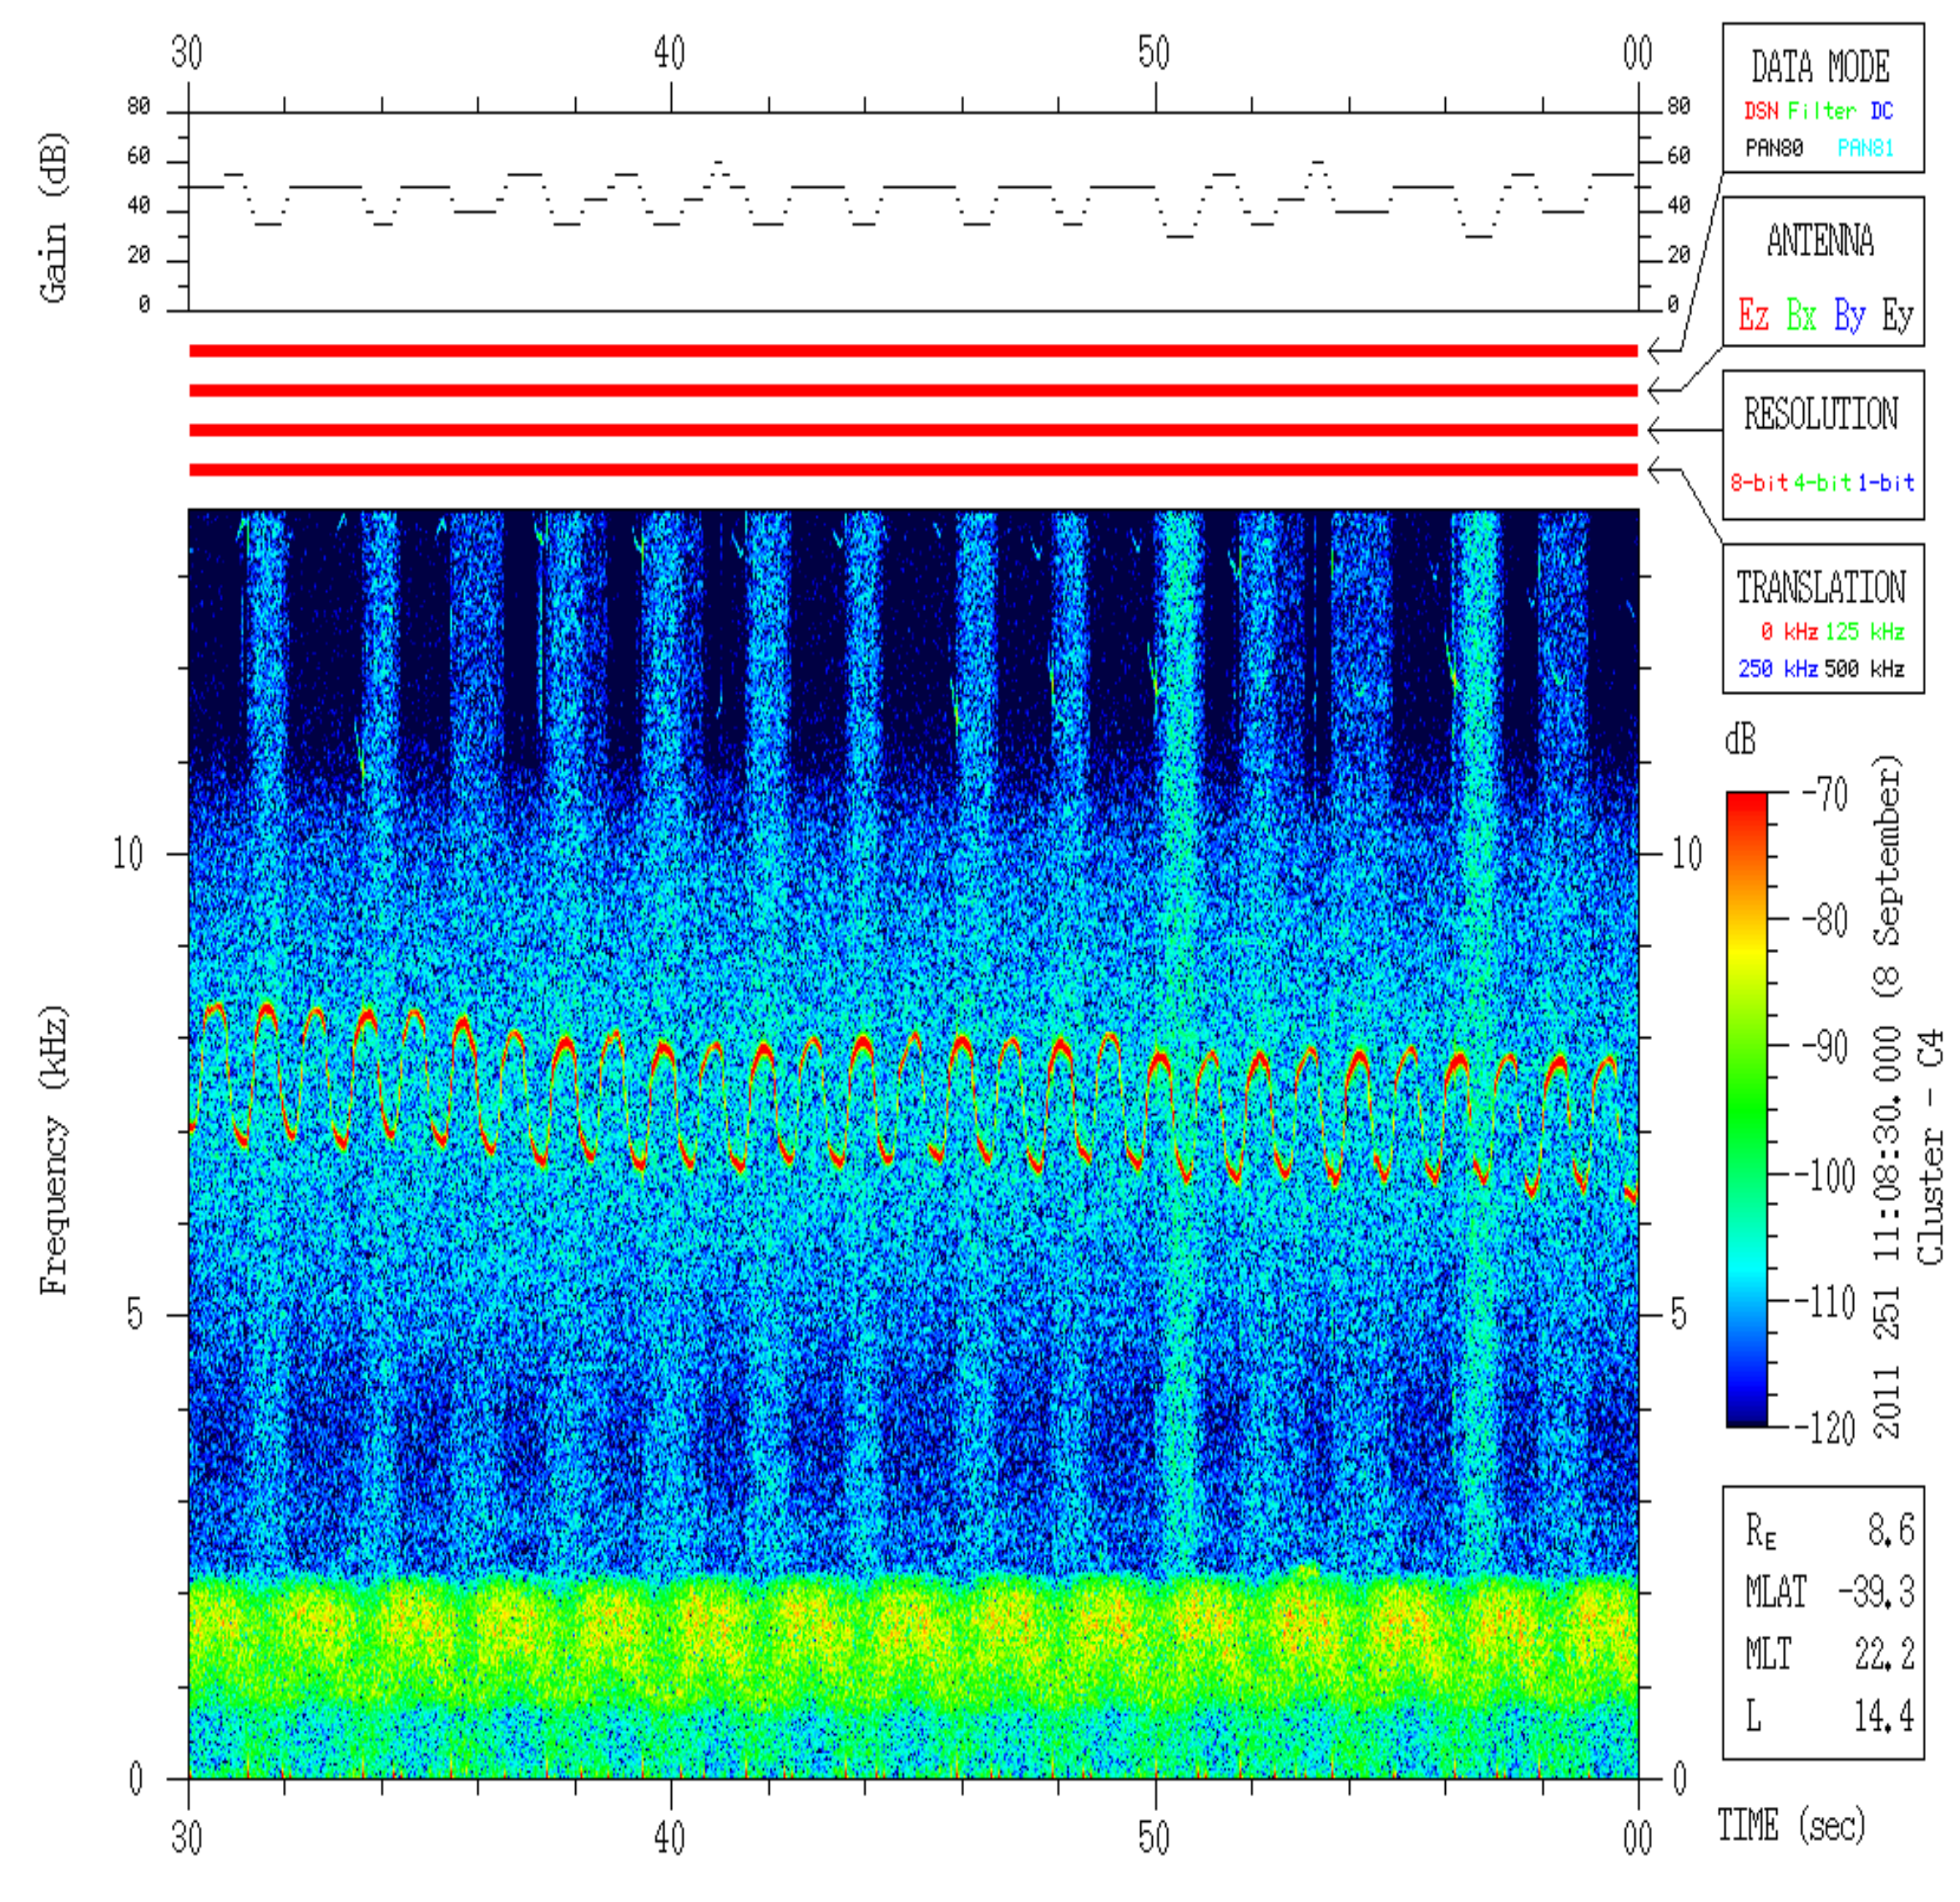
Figure 12 shows a more recent case of this interference on Cluster spacecraft 1, 2 and 4 on September 8, 2011 in a similar region, and persisting over many minutes. Here the interference is seen to be oscillating between more than one frequency, particularly on spacecraft 4. A high time resolution, 30 second, plot clearly exhibits this feature in Figure 13.
The interference is most likely to be observed in low density regions, night magnetic local times and high magnetic latitudes. More specifically for Cluster's orbit, these locations are:
- 5-13 RE, 22:00 - 02:00 MLT (through midnight), 25-55 deg. Magnetic Latitude
- 15-22 RE, 20:00 - 02:00 MLT (through midnight), 25-40 deg. Magnetic Latitude
An example of the interference observed in the far magnetotail (region 2 above) is seen in the bottom panel (spacecraft 4) of Figure 19 in the last section on "High Noise Floor". The interference is now known to be associated with the electronics within the electric field antennas (used by WBD). Changing the voltage settings of the guard, and/or the bias current settings of the probes (both components are located at the end of these antennas), can affect the intensity of the interference. Some combinations of settings can sufficiently suppress the interference. Whether the antennas are interacting with the plasma, with the resultant interference coupling through the plasma being measured by WBD (most likely), or coupling strictly onboard through the electronics (cross talk), is not known at this time. The characteristics of the probes at the end of the electric field antennas have changed over the lifetime of the mission, thus requiring infrequent changes of the guard voltage and probe bias current in order to suppress the interference. Significant changes in these settings were required on all spacecraft after the perigee of the orbit dipped below 500 km in 2011, particularly on spacecraft 2. In addition, more recently spacecraft 4 seems to be affected more than the other spacecraft, exhibiting the most variation in the periodic interference pattern and with a higher probability of occurrence. One possible reason for this is that all four probes are properly functioning in the electric field mode, which is not the case on any of the other three spacecraft. With regard to interpretation of the data, we do know for certain that these emissions are not natural plasma emissions and that the frequency of the interference sometimes correlates with the spacecraft potential (which is a proxy for electron density). Caution needs to be used when analyzing data during periods of time when these interference patterns are present.
Instrumental Effects: Waveform Distortion
The digital filters used within the WBD instrument for its three bandwidth modes (9.5, 19 and 77 kHz) and the 300 Hz boom buffer amplifier mounted within the electric antenna that WBD uses have specific response characteristics that are optimized for the detection of multi-cycle, sinusoidal type waveforms. Thus, when impulse-type waves, such as solitary waves, are detected by the WBD/electric field antenna system, some of the actual input waveforms get distorted at the output after processing through these various filters. The point (in terms of solitary wave or pulse time duration) at which the waveforms are distorted is driven by the characteristic response time of the filters, 1/(2*pi*f), where f is the RC time constant. A number of bench tests using the WBD flight spare instrument were carried out at Iowa to verify this turning point experimentally. The results of those tests can be found in the BSc thesis "WBD Response to Bipolar and Tripolar Pulses: Bench Tests vs. in Flight Observations", by J. M. Swanner, J. S. Pickett, J. R. Phillips, and D. L. Kirchner (see https://space.physics.uiowa.edu/plasma-wave/cluster/pulse_tests.pdf) For these tests, some solitary waves in the form of bipolar and tripolar pulses were input using a signal generator and the output examined in terms of shape and pulse duration. The referenced document provides some guidelines for each WBD filter mode for the maximum time duration that can be trusted for pulses that are observed with a bipolar or tripolar shape. Any pulses of this type that are observed in the data to have time durations longer than the suggested guidelines should not be used for analysis purposes other than if the researcher clearly states that these pulses, although considered to be solitary waves, cannot be characterized in terms of specific shape, time duration or amplitude. Solitary waves detected with the electric antennas are one of the types of waveforms that are manifested as broadband electrostatic noise in spectrograms created using a Fast Fourier Transform routine.
Instrumental Effects: Harmonic Generation
In many regions of space, plasma physics theory predicts the observation of waves at harmonics of natural frequencies. Some measurements of harmonics may indeed be related to natural phenomena. However, it is a well-known fact that plasma wave receivers, and amplifiers in general, can artificially introduce signals into wave data that appear to be waves at harmonics of fundamental natural frequencies.
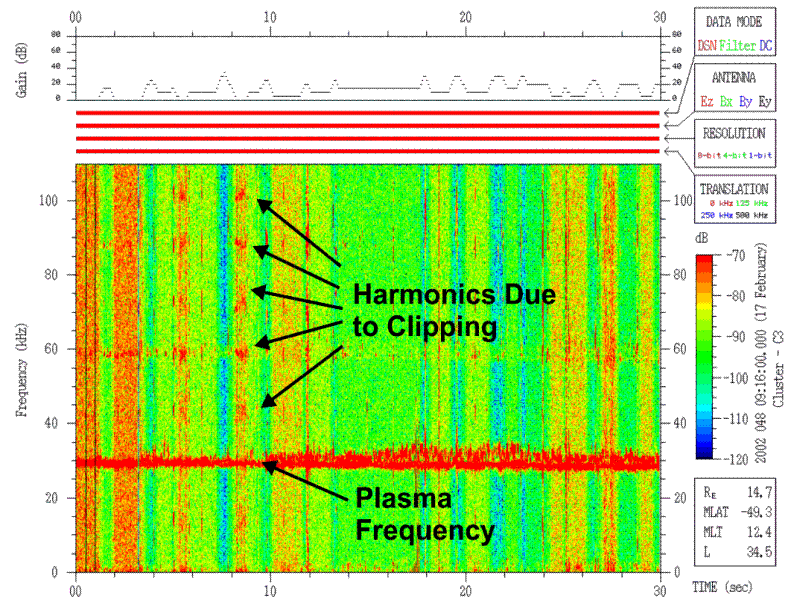
One source of artificial harmonics in WBD power spectra is the clipping of waveforms when they exceed the amplitude range of the instrument. In the automatic gain control (AGC) mode, the WBD Plasma Wave Receiver gain state is adjusted to keep the average measured signal within the range of the digitizer. The rate at which the gain state is updated can be as fast as once every 0.1 s. However, wave amplitudes can change much more rapidly than the fastest gain update rate. This can result in occasional clipping of the waveform peaks when the wave amplitudes exceed the range of the current gain setting. The power spectra of clipped waveforms generally exhibit significant power at odd harmonics of the plasma frequency, while the even harmonics feature relatively low power. These harmonics are a purely instrumental effect [see Walker, S. N., M. A. Balikhin, I. Bates, and R. Huff, An investigation into instrumental nonlinear effects, Adv. Space Res., 30 (12), 2815-2820, 2002]. An example of a spectrogram with clipped waveforms is shown in Figure 14.
A second source of artificial harmonics is the amplifiers used in the plasma wave receiver. Harmonic generation is a problem for most amplifiers, including those used in the WBD instrument. Although the WBD design attempts to suppress instrumental harmonics, they are often present at intensity levels about 40 dB below the peak in the power spectra at the fundamental tone. In addition, harmonic generation appears to be more prevalent when the wider 77 kHz bandwidth mode is used, as opposed to the narrower 9.5 kHz and 19 kHz bandwidth modes. In order to better understand when and in what modes these harmonics are most likely to occur, comprehensive WBD bench tests were carried out to enable us to characterize which of the harmonics observed in the data are natural and which are instrument generated. The results of this are briefly touched upon in Sigsbee et al., Journal of Geophysical Research, 115, A10251, doi:10.1029/2009JA014948, Oct. 29, 2010. Researchers using WBD data thus need to be extremely cautious about their interpretation of any harmonics observed in the WBD data and should contact the WBD PI for further information.
Saturation of Magnetic Field Data at Low Altitude
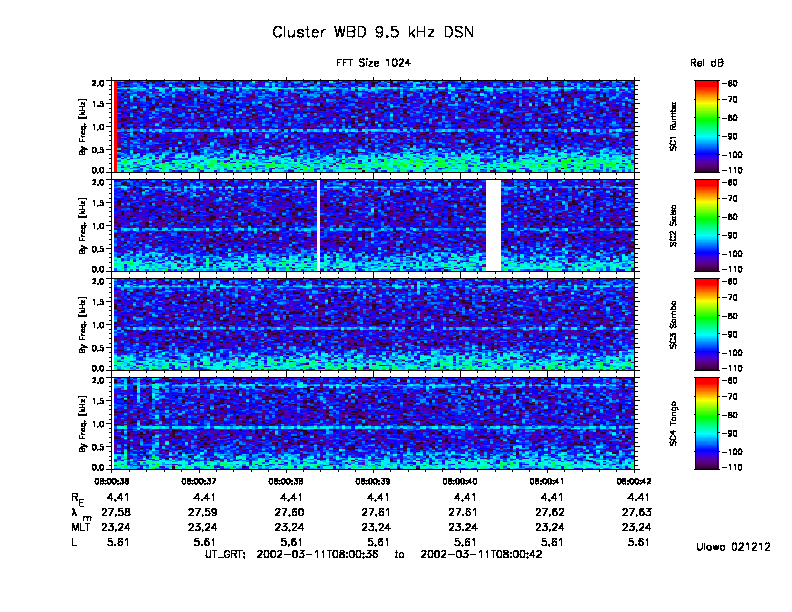
In late 2008 it was discovered that due to naturally decreasing perigee height, the Cluster spacecraft were transiting very high magnetic field regions not previously planned for or encountered in the Cluster mission before that time. In this region, the spin plane magnetic search coils (the By and Bz antennas) saturate during part of every spin such that the data cannot be calibrated. The spin axis magnetic search coil (Bx) does not suffer this saturation since it is always oriented more perpendicular to the ambient magnetic field direction in this region near perigee. The saturation of the spin plane antennas usually starts to become a problem at geocentric distances of 3.5 RE and lower. Figure 15 shows an example of this saturation in the WBD data while the By antenna was being used on spacecraft SC1, SC2 and SC4 on January 30, 2009.
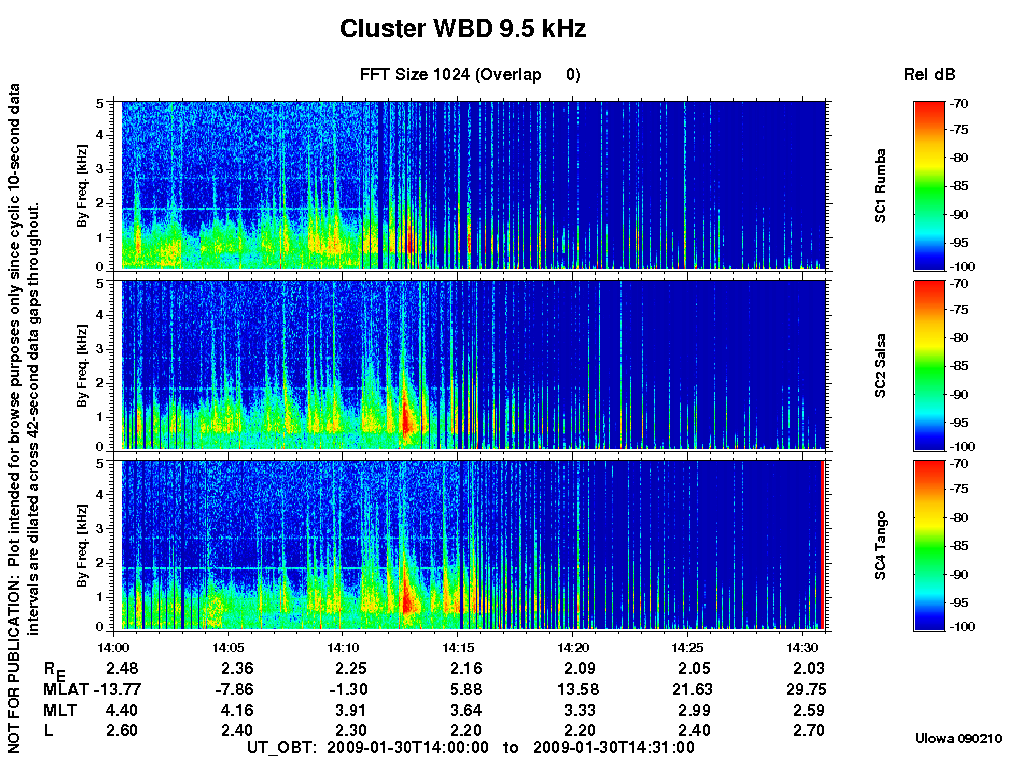
Intermittent vertical blue stripes covering the entire frequency range start to appear first in SC2 and SC4. By 14:15 all three spacecraft are low enough that the By antenna is in saturation during large portions of each half spin, resulting in mostly solid blue color across all frequencies in this spectrum-averaged plot. Figure 16 shows a high resolution 30-second spectrogram from SC1 starting at 14:20:00 UT. From ~14:20:11 to 14:20:21 UT the WBD receiver is using the magnetic search coil By antenna. At this time large amplitude magnetic fields are encountered twice per spin leading to saturation observed as dark blue across the entire frequency spectrum. Starting July 11, 2009, WBD began to use the Bx antenna for all of its operations below geocentric distances of 3.5 RE in order to avoid saturation. Thus, these Bx data can be calibrated and used in the interpretation of interesting plasma waves observed at these lower altitudes.
High Noise Floor on Cluster Spacecraft 1 Since November 30, 2009
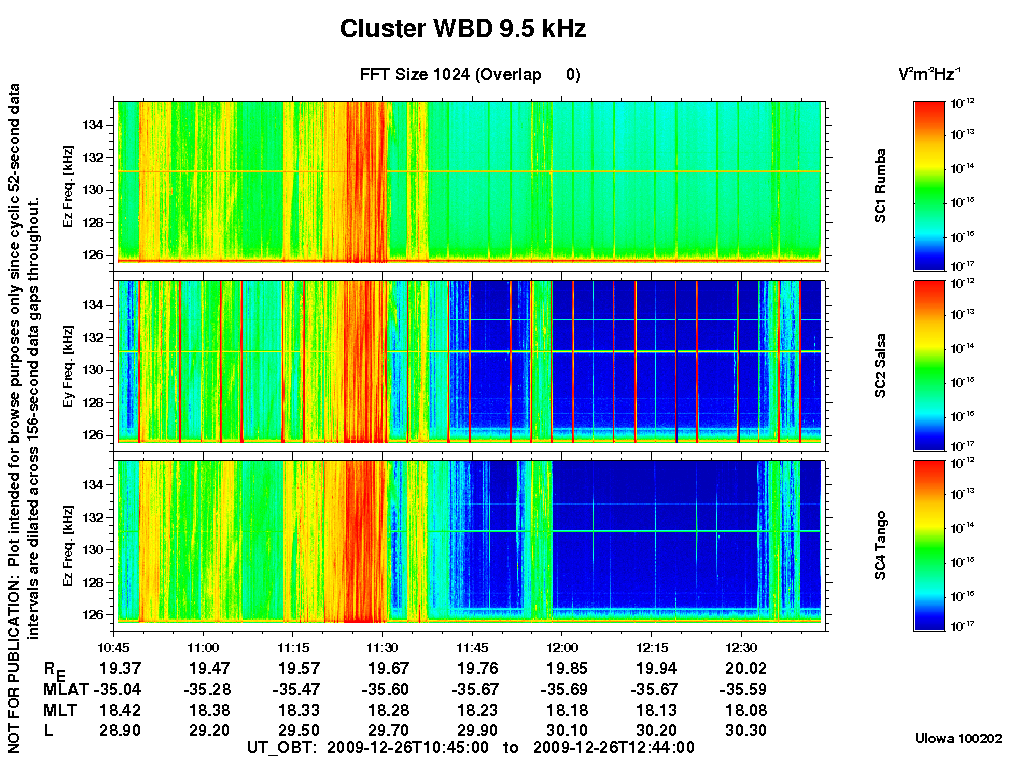
EFW probes 1 and 2 comprise the Ez antenna while EFW probes 3 and 4 comprise the Ey antenna. These probes are the dipoles used by WBD to make its electric field measurement, taking the average potential between the two probes divided by the antenna length. The two probes on any one antenna are separated by 88 m, with the spacecraft body being in the center of the two probes. Both the Ez and Ey antennas are in the spin plane. The Ez antenna is the antenna of choice for WBD measurements because the WHISPER sounder uses the Ey antenna to carry out its soundings of the plasma and this leads to interference as discussed above. Unfortunately, the Cluster 1 EFW electric antenna probe 1 failed at the very end of 2001, requiring WBD to begin using the Ey antenna in order to get an electric field measurement with a preferred greater probe separation. In the fall of 2009, EFW probe 4 also failed on that spacecraft, thus forcing WBD to use an antenna that was half as long as before, i.e., a 44 m antenna consisting of one functioning probe and the spacecraft body as the other probe. Due to the interference on Ey caused by WHISPER, WBD switched to using the now 44m Ez antenna for its measurements on Cluster 1. The shorter probe separation length, however, leads to increased noise in the measurement as shown in Figure 17. Also evident in this figure are the WHISPER sounding interference for spacecraft 2 (the middle panel), which is using the Ey antenna, and interference associated with the power and battery subsystem as discussed above. Since there is a larger error bar associated with the calibrated WBD data when using the shorter 44m electric field antennas, the user of WBD data is encouraged to read the Caveats document available on the WBD website and the CAA website, as well as the WBD Calibration Report and WBD User Guide available on the CAA website.
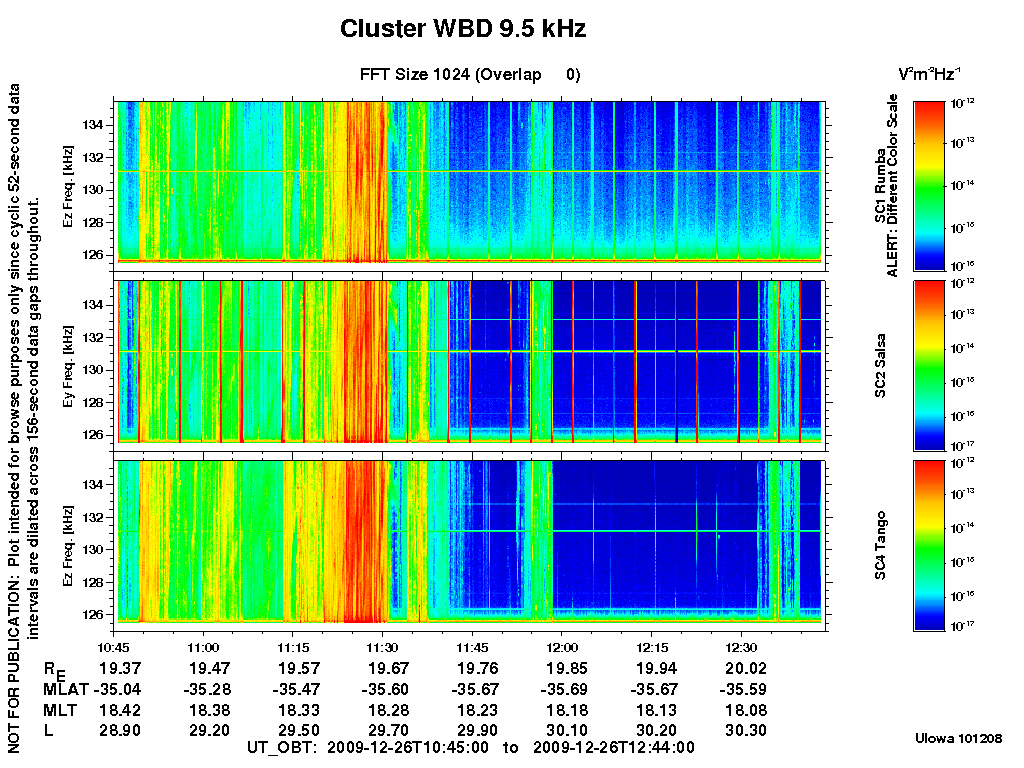
WBD has always created its multi-spacecraft survey spectrograms with the same color scale for the wave intensity for each spacecraft panel in order to compare the spectra with regard to intensity across the different spacecraft. However, due to this increase in the noise floor on spacecraft 1, which hides some of the details of the lower intensity waves in particular, we have decided to change the color scale, when necessary for this spacecraft in order to better bring out the details. This primarily means raising the lower end intensity by one order of magnitude when plotting the data as shown in Figure 18 (the same as Figure 17 but with the altered color scale). An "ALERT" is posted next to the spacecraft name and color bar on the right side of the affected panel to call attention to this difference.
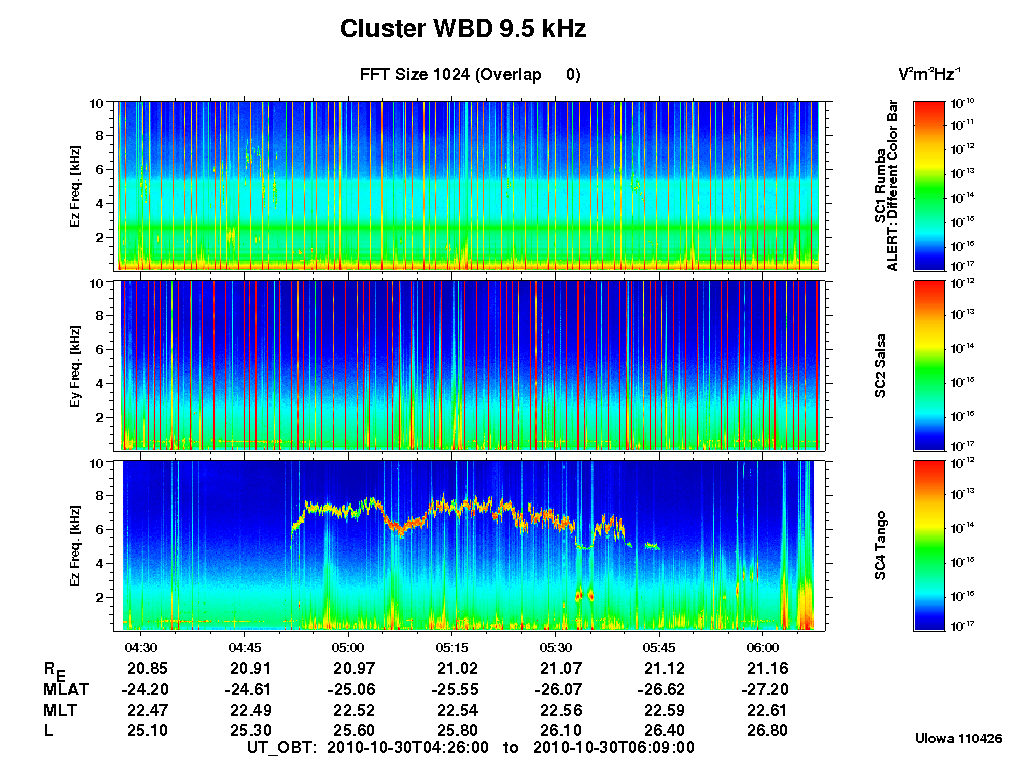
For some regions of the magnetosphere where primarily lower frequency (< 5 kHz), lower intensity emissions are present, this higher noise floor is most apparent. This can lead to obscuration of these naturally-occurring lower frequency emissions even with an altered color scale for C1 as shown in Figure 19. Note also the appearance in the third panel (spacecraft 4) of the interference associated with the electric field antennas discussed in the section on "Interference from Electric Field Antennas".
pickett@uiowa.edu, project PI