×

About

People

Outreach

Science

Data & Tools

Photos

Commissioning

WBD Home

CLUSTER WBD Spectrogram Plotting

This application uses IDL procedures to apply FFT spectral analysis to Cluster WBD waveform data and produce a plot consisting of up to four panels for four spacecraft.

Common Specification

These input and processing selections are common to all panels. Be sure to verify available spacecraft modes for a given time range.

Time Type:
Begin Time:   End Time:

Data Mode:
Bandwidth: kHz
Frequency Offset:

FFT sizes above 1024 only work for 9.5 kHz bandwidth.

FFT Size:

Amplitude Units: Power
Frequency Scale:   to kHz

Width and height (in pixels) apply directly to GIF output, but also affect PS aspect ratio.

Width:
Height:
Plot output: File

Make selections for individual spacecraft below.

Antenna:
Amplitude Scale:   to

Notation (on y-axis):

Antenna:
Amplitude Scale:   to

Notation (on y-axis):

Antenna:
Amplitude Scale:   to

Notation (on y-axis):

Antenna:
Amplitude Scale:   to

Notation (on y-axis):

Email larry-granroth@uiowa.edu with questions or problems.

View your most recent log file.
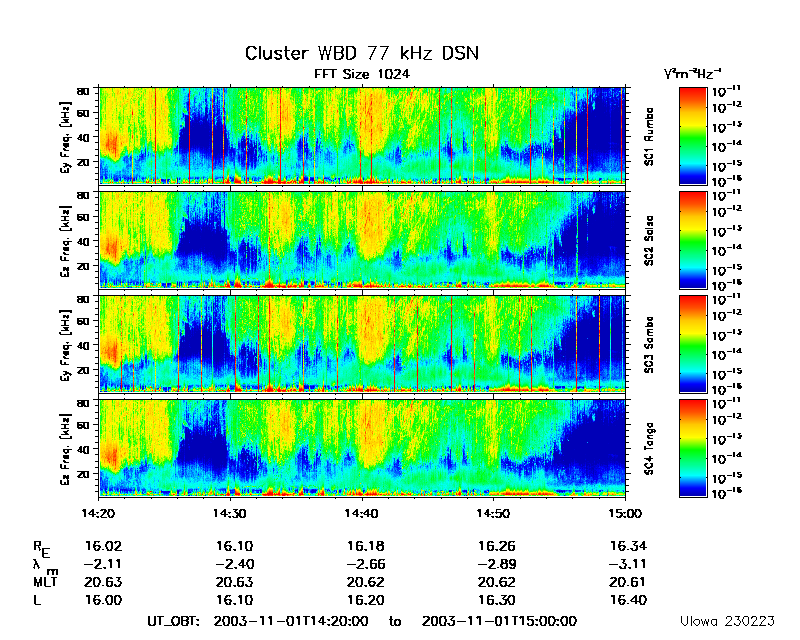
Mode information will display here.  GIF plot will replace example below.
Cluster WBD spectrogram plot. ---