×

About

People

Outreach

Science

Data & Tools

Photos

Commissioning

WBD Home

CLUSTER WBD Wavelet Plotting

This application uses IDL procedures to apply wavelet analysis to Cluster WBD data and produce a plot.

Input Selection

Begin Time:   End Time:

Data Mode:    Spacecraft:

Plot Processing

Wavelet Type:    Significance Level: %

X-Scaling:    to s Y-Scaling:    to kHz

Plot output: File

Manual Labels

These selections don't affect the data processing. The label is used only if the panel (corresponding to a selected spacecraft) is present. Be sure to check the available modes. An incorrect selection here will result in incorrect labels.

Antennas:
Panel1  
Panel2  
Panel3  
Panel4

Bandwidth: kHz

Email larry-granroth@uiowa.edu with questions or problems.

View your most recent log file.
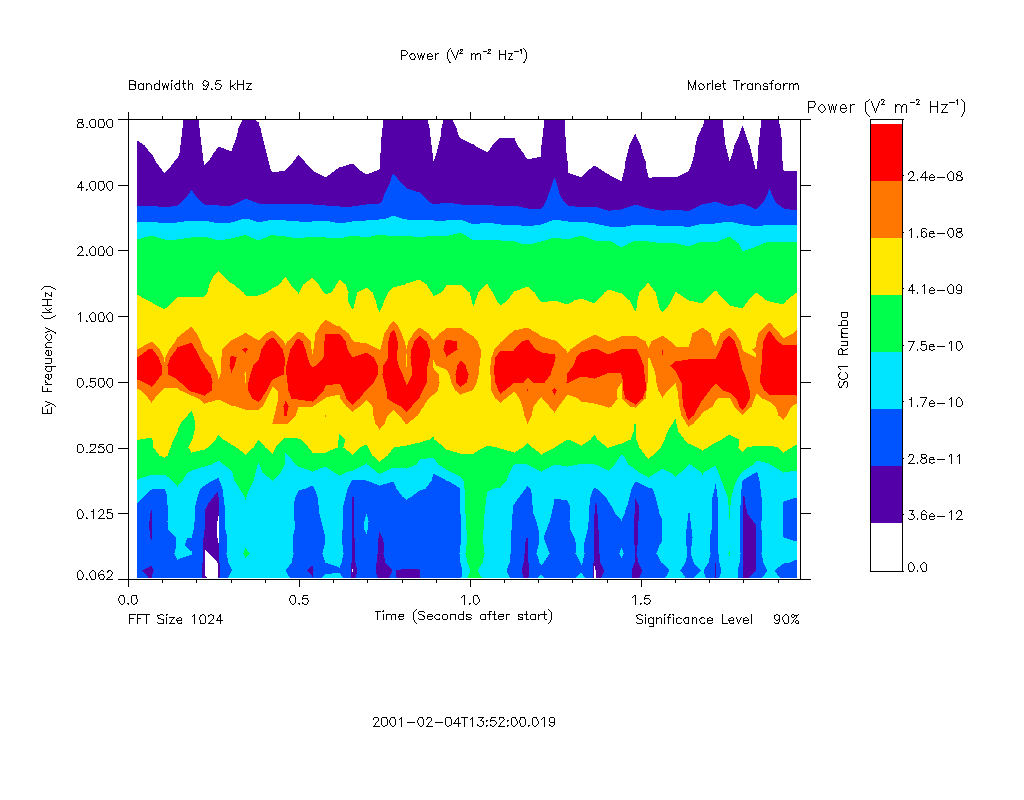
Mode information will display here.  GIF plot will replace example below.
Cluster WBD wavelet plot. ---