Begin time:
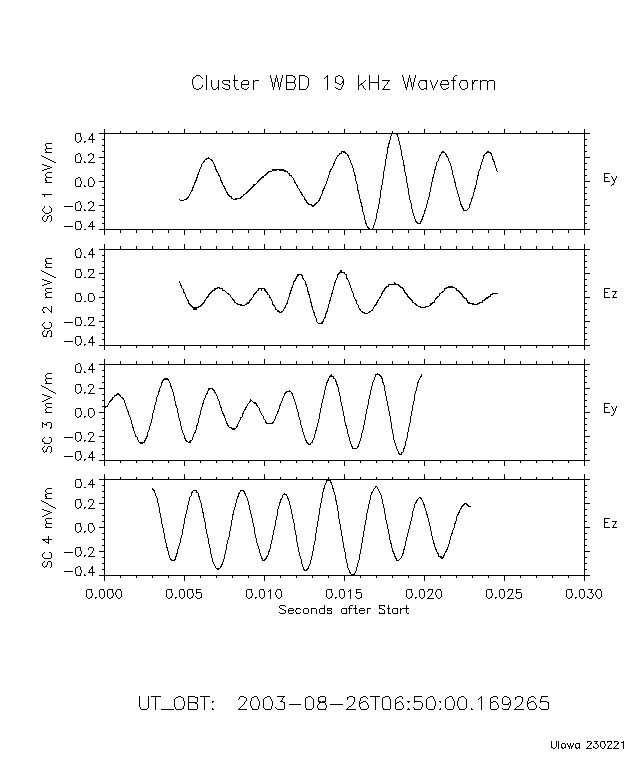
Plot # in Sequence: for spectrum plots or automatically X-scaled waveform plots. Default time span is 1 second, in which there will be approximately 25 snapshots of 1090 points each. WARNING: Data received in digital filtering mode (Burst/Filt) at 9.5kHz (the only applicable bandwidth for that mode) are currently not displayed correctly.
Data Source: DSN Burst/DC
Bandwidth (kHz): 9.5 19 77 Any
Translation (kHz): 0 125 250 500 Any
Panel 1 Antenna: Ez Bx By Ey Any
Panel 2 Antenna: Ez Bx By Ey Any
Panel 3 Antenna: Ez Bx By Ey Any
Panel 4 Antenna: Ez Bx By Ey Any
If Antenna other than "Any" is selected, then it could prevent data retrieval on the plot(s) if chosen incorrectly. Verify the available instrument modes for the time selected.
Calibration: Calibrated Raw
Show Clipping: No Yes
Automatically X-scaled waveform plots will contain 1090 points each. To get a longer waveform plot, set X-Scaling to manual and enter new times. In manual mode you will get ONLY ONE waveform plot.
Calibration: dB Calibrated
FFT Size: 1090 1024 512 256 2048 4096 8192
FFT sizes greater than 1090 will work ONLY with continuous (9.5 kHz) data.
X-Scaling: Automatic Manual: Low High
Units above are seconds after begin time for waveform plots or kHz for spectrum plots.
Y-Scaling: Automatic Manual: Low High
Units above are mV/m or nT or raw counts for waveform plots, or V2m-2Hz-1 or nT2Hz-1 or dB for spectrum plots.
Output Format: application/postscript image/gif
Number of Panels: 1 2 3 4
Panel 1 Spacecraft: 1 2 3 4
Panel 2 Spacecraft: 1 2 3 4
Panel 3 Spacecraft: 1 2 3 4
Panel 4 Spacecraft: 1 2 3 4
Email larry-granroth@uiowa.edu with questions or problems.
View the error log from your most recent plot attempt.
Mode information will display here. GIF plot will replace example below.