
This document provides some general caveats related to the analysis of the data from the Cluster Wideband Data (WBD) plasma wave instrument. Various known problems associated with using the data are detailed below along with appropriate cautions related to those problems. In addition, the user of WBD data is also referred to the "Cluster WBD Interpretation Issues" document which is archived at the Cluster and Double Star Science Archive (CSA) (https://www.cosmos.esa.int/web/csa/access). It discusses issues related to known interferences and design issues of the instrument that could possibly lead to a user's misinterpretation of the data. If you need further information on these problems, caveats and interpretation issues, please contact Jolene Pickett, Principal Investigator, at: pickett@uiowa.edu, and in addition, consult the WBD User Guide and Calibration Report documents which are archived at the CSA.
Large Data Volume
Because of the high sampling rate of the WBD data (27.4 to 219.5 kilosamples per second), the time resolution of the WBD data (~36 to 5 microseconds in the time domain) is very high. This results in a very large data volume. Because of this the WBD data are stored in CEF files (and in CDF files from which the CEF files were generated) with maximum length of 10 minutes and size of a few hundred Mbytes. The user of WBD data is thus cautioned to take this into consideration when requesting WBD data downloads from the CAA. The 10 minute CDF files can also be downloaded from NASA's CDAWeb.
Limited Data Coverage
Because of the high time resolution of the WBD data discussed in the previous section, it was usually not possible to obtain WBD data simultaneously on all four Cluster spacecraft throughout every orbit. It is only through direct downlink of WBD data to ground receiving antennas at the Deep Space Network (DSN) and Panska Ves Observatory that such high time resolution data were obtained. This then limited how much WBD data could be obtained as ground receiving antennas must have visibility of the spacecraft, which is not possible for a large part of any orbit, and the spacecraft must not be running burst mode or other operations which prohibit the downlink of WBD data to the ground. In addition, the ground services can be quite expensive. Since one ground receiving antenna is required to receive the data from only one Cluster spacecraft, it takes four antennas at any one DSN complex to obtain simultaneous data from all four WBD instruments, unless two of the spacecraft are close enough to pick up the signals from those two spacecraft with one antenna.
For the first six years of the mission WBD was sometimes able to get four spacecraft coverage using one ground antenna per spacecraft at each of the DSN Goldstone and Canberra complexes, but after that it was only possible at Goldstone since Canberra (and Madrid) had only 3 antennas with the S-Band capability needed by Cluster. If Cluster was using all of the antennas at any one DSN complex, it meant no other mission serviced by DSN could downlink their data, or uplink commanding, to that complex. Thus, between visibility and contention from other missions, WBD was more likely to get data from at most three or fewer spacecraft simultaneously. DSN stopped obtaining WBD data in February 2015. Panska Ves, which started obtaining WBD data in 2007, had only two 10 m antennas up to March 2021, allowing for at most two spacecraft WBD coverage, or three if two of the spacecraft were sufficiently close, up to about 13 RE. Data from one spacecraft could be obtained up to about 15 RE with one antenna (much less than that with one antenna in the later years due to diminishing transmitting power on the spacecraft, but sometimes it was still possible to track one spacecraft to that distance using both antennas). Panska Ves added a 6.1 m antenna to its observatory in March 2021 which allowed for obtaining WBD signals up to about 10 RE. This opened up the possibility of obtaining WBD data from three spacecraft, or four if two spacecraft were close enough to be picked up by one antenna, but only for distances sufficiently close to earth.
For all of these reasons primarily associated with receiving WBD data directly at ground stations, WBD only received approximately 25-45 hours of data per week spread across all spacecraft. The data coverage periods are targeted for regions of highest scientific interest, those being all boundary layers, the inner magnetosphere and the auroral acceleration region, or for regions where remote sensing of waves such as auroral kilometric radiation is ideal. The user of WBD data is thus cautioned to first download the data "Coverage" files archived at the CAA. These files are in ascii format showing the times when WBD data were obtained, by spacecraft, and the mode in which the data were taken. Further, the user is encouraged to download the WBD "Science Summary" html documents, also archived at the CAA and available from start of mission in 2001 up to 2009. These documents provide the details of when each spacecraft received data, as well as the region or scientific focus that the operation was targeting. Each operation will not always be successful in hitting the intended target, since in some cases it is hard to target a specific region with a 1-2 hour operation, for example the bow shock where the time of the crossing could vary up to 4 hours either way from the predicted time of the crossing. Both the WBD Coverage files and the Science Data Sheets are archived in the CAA,"Documentation" section, under WBD. These files are also available on the Cluster WBD website (https://space.physics.uiowa.edu/plasma-wave/cluster/).
Cluster Spacecraft 2: Corruption of Data and Status Bits
WBD data received from Baikonour tests just prior to launch in 2000 revealed various problems with the WBD transfer frames that most likely originated in the Cluster Onboard Data Handling (OBDH) System on Cluster 2 only. Because these problems were discovered so late, it was not possible to do further diagnostics and correct the problems. Further it was felt that some of the problems could be worked around in ground processing. This turned out to be the case for some corruptions of some of the bits within the transfer frame but not all. Below we provide the details of those corruptions that could not be fully dealt with. Users of Cluster spacecraft 2 data must thus make themselves aware of these problems and use the data with caution.
1. WBD Waveform Data Corruptions
When a WBD waveform data point on spacecraft 2 has a raw data value of 80 (hexadecimal), the following data point will usually have an invalid, but predictable, value. For these cases, WBD processessing software has replaced the invalid value with a fill value to signify that the value is bad and not deterministic. In this case, Iowa has also placed a value of 2 into the Data Quality variable in the Common Data Format (CDF) files (and thus the Cluster Exchange Format, CEF, files) for this data sample. Users of the WBD CDF and CEF files are encouraged to check for fill values for any data point for this spacecraft, and if a fill value is found, check if Data Quality is 2. If yes, in order to preserve the data surrounding that filled data point, it would be acceptable in most cases to average across the adjacent data points provided there is no data gap between the filled data point and either of the adjacent data points.
2. WBD Status Corruptions
Occasionally, any one of the WBD status bits can be corrupted. These status bits provide information about the mode and gain state of the instrument. WBD software corrects the decommutated status bits written into the CDF and CEF files when this status bit is a mode bit, such as antenna being used, bandwidth, and translation frequency since these are known from what was commanded. WBD software also corrects some of the corrupted gain states when it is possible to determine what they must have been based on allowed gain state changes (maximum of one 5 dB gain step at the gain update rate). However, in most cases it is not possible to determine the correct gain state so the invalid gain state has been replaced with the valid gain state closest in time. Because the calibration for the WBD data depends on knowing the correct gain state, the calibration that is applied to a frame with an errant gain state will be incorrect. This is usually apparent in a spectrogram of the data as a more or less intense spectral slice compared to those on either side of it (note, however, that a gain state error is certainly not the only possible cause of such an artifact on the spectrograms). Corrupted gain status bits may occur randomly throughout a WBD data interval, or they may be totally absent. In the worst case, there may be up to 50 such corruptions per 10 minute file, affecting the calibration of a maximum of one-third of one percent of the data points in the file. Incorrect or invalid gain states are sometimes detected in the data from the other three spacecraft, but there is usually no more than one or two per 10 minutes unless the data are noisy or filled with data gaps. These cases are handled the same way as on Cluster spacecraft 2.
Calibration Issues
1. Calibration of Electric Field Data Following Probe Failures
On May 13, 2007 at 03:23:48 UT, Probe 1 of the EFW Ez antenna on spacecraft 2 failed. The primary effect of this failure is that WBD, when using the Ez antenna, has lost one-half of the signal strength, relying only on the signal from Probe 2 of the Ez antenna. However, the situation is more complicated than this based on some special tests carried out on June 13, 2007 and July 29, 2007 in which WBD was switched between the Ez and Ey antennas in both the 9.5 kHz and 77 kHz bandwidth filter modes in order to characterize the exact signal loss while on Ez. The test data indicate that there is probably a frequency dependence related to effective antenna length, and thus the region of space in which the measurements are made. This being the case, WBD switched to using the nominal 88m Ey antenna for all Cluster 2 operations beginning on July 8, 2007. The Cluster 2 WBD data obtained with the Ez antenna after the failure on May 13, 2007 have been made available to the CAA by applying a 6 dB correction in order to account for the loss of half the signal. This correction does not take into account any frequency dependent differences, which are probably on the order of an additional 3-5 dB at most. Thus, the user needs to use these calibrated data obtained with the Ez antenna following the Probe 1 failure on Cluster 2 on May 13, 2007 with extreme caution, knowing that the calibrated amplitudes have a larger error bar. A similar situation exists for WBD data on Cluster 1 and Cluster 3. A probe 1 failure on Cluster 3 in mid 2002 has led to WBD using the full 88m Ey antenna for its measurements. Occasionally Cluster 3 WBD data are received with Ez for small periods of time (< 5 s) at the beginning of a track. This is because Ez is the default mode since launch and the command to switch to the Ey antenna at the start of an operation takes a few seconds to be completed. The same is true for Cluster 2. Cluster 1, however, has suffered a probe failure on each of the Ez (in December 2001) and Ey (in October 2009) antennas. From January 2002 through October 2009, the full 88m Ey antenna was used by WBD for all Cluster 1 operations. After the probe 4 failure on the Ey antenna on Cluster 1 in October 2009, all WBD operations since Nov. 30, 2009 have been carried out with the shorter 44m Ez antenna. Further probe failues after 2009 continued to the end of the mission on various spacecraft resulting in WBD continuing to switch which electric antenna it used at any given time with the resulting possible change in calibration. Users of WBD data are encouraged to consult the WBD Calibration Report and WBD User Guide regarding this issue, where a table is provided showing which antennas where used on each spacecraft throughout the mission. These documents are available on the Cluster Active Archive.
2. Calibration of Magnetic Field Data
Although the WBD receiver in its smallest bandwidth (9.5 kHz) acquires data in the passband 70 Hz to 9.5 kHz, magnetic field measurements made using the STAFF magnetic search coil as the sensor can only be calibrated up 4 kHz. Thus valid calibrations are available to WBD only up to that frequency. Although WBD will detect valid, intense magnetic signals at frequencies higher than 4 kHz, there is no possibility to calibrate those data. Thus, the users of WBD magnetic field data are cautioned to analyze only those WBD magnetic field data in the frequency range of 70 Hz up to 4 kHz.
Time Tag Issues
The time tags delivered with WBD data through the WBD website are those derived by using the onboard time counter values contained within the WBD transfer frames. If requested, these values are corrected to 50 microsecond accuracy or better through the application of the time corrections contained within the TCOR files supplied to the CAA by Sheffield University. The Epoch variable contained within the WBD CDF/CEF files will either have times derived from the onboard time counter corrected with the use of the TCOR files, or derived from the ground receive time stamps corrected for onboard system delays and transmission time to the ground station. The WBD team has determined which one of these two will be most accurate and inserted this into the Epoch variable. The accuracy regardless of which time derivation method is used is 50 microseconds or better. For WBD data obtained through Burst Mode 2 (BM2), i.e., recorded onboard with data from all the other instruments, there are no options for deriving the time through independent ground receive time stamps. Thus, BM2 data time tags are derived through the onboard time counter with applied TCOR corrections.
During the period February 20, 2009 20:24:33 UT to March 7, 2009 04:40:04 UT, all data from all instruments apart from WBD on Cluster 3 were processed with incorrect time calibration factors by the European Space Operation Centre. Conversely, the WBD data received from this spacecraft in the same period of time were processed with the correct time calibration factors. Thus, cross analysis of WBD data with data from any of the other instruments on this spacecraft during this specified interval of time will be problematic when trying to compare data on a time basis with high precision. In addition, the time correction factors obtained from the TCOR files, which are applied to the onboard derived time tags to obtain better accuracy, are not valid for WBD data for Cluster 3. The TCOR values are valid only for data from the other wave instruments. There is no way to recover the TCOR time corrections needed for onboard derived time tagging of Cluster 3 during the specified interval so as to obtain better time accuracy. However, the ground receive based time tags are provided in the WBD CDF/CEF files and they are accurate to around 50 microseconds. WBD received data from Cluster 3 on only five days during this period of time, those being 23, 26 and 28 February, and 03 and 07 March, all 2009.
Time Scale and Appearance of Waveform Data Obtained During Conversion Modes (125/250/500 kHz)
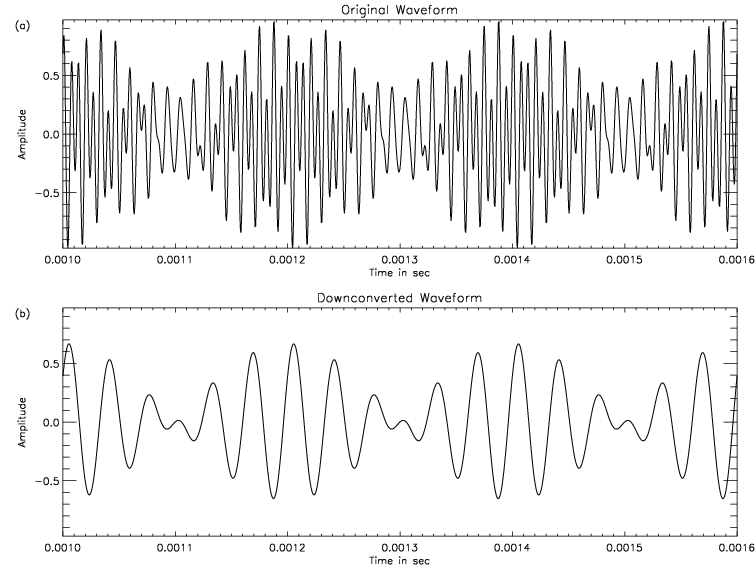
When data are obtained in any of the frequency conversion modes (when the lower edge of acquired frequency band starts at approximately 125 kHz, 250 kHz or 500 kHz), a key part of the process within the WBD instrument is to downshift the frequency components of the raw analog signal, through a combination of filters, so that the lower edge of the desired band is instead at 0 kHz. This process is called downconversion. It is this downconverted signal that is then digitized to become the WBD data set. This process preserves the frequency information in the signal (spectrograms of the original signal are easily recovered by simply adding the amount of downshift back on to the frequency values when plotting or analyzing), but it necessarily does not preserve the shape of the waveform. This means that when these downconverted data are plotted as amplitude vs. time, the result is the waveform of a signal with frequency content of ~0-9.5 kHz, ~0-19 kHz or ~0-77 kHz (depending on the bandwidth selected prior to obtaining the data), not the waveform of the original signal that existed in the higher frequency band. This can cause the time scale of waveform features to be significantly different from what the user might expect, so extreme caution needs to be taken when analyzing such waveforms.
This is best illustrated with a couple of simple examples, using a conversion frequency of 125 kHz, for instance. First, consider a simple original signal consisting of only a pure sinusoid at 150 kHz. In the downconverted waveform, this would appear as a 25 (150 - 125) kHz sinusoid. This sinusoid would thus have a period of 40 microseconds (1/25000 Hz) when plotted, not the 6.7 microseconds (1/150000 Hz) as one would expect from a 150 kHz sinusoid. Adding now a second pure sinusoid at 155 kHz, the original signal (simulated in Figure 1a) shows the expected envelope modulation resulting from the beating of the two closely spaced sinusoids. In the downconverted signal (Figure 1b), we see that the timescale of the beat feature does not change (not unexpected, since the beat frequency is a function of the frequency difference between the two sinusoids, and this difference is unchanged by the downconversion process), yet the timescale (i.e. the period) of the "carrier" wave does change. Thus, we see that a simple rescaling of the plot's time axis cannot recover the original waveform. Extending this to a real signal, consisting of many Fourier components mixed together, it is clear that the downconverted waveform will in general look quite different from that of the original signal, and that recovering the original signal would be a non-trivial, and inexact at best, task. For this reason, all conversion mode WBD waveform data delivered through the WBD website (link provided above), as well as the waveform data contained within the CDF and CEF files located at the CAA (link provided above), will contain these unmodified downconverted waveforms. A warning related to this is provided with the Epoch, Translation (i.e., conversion mode), and WBD_Elec variables contained within the CDF and CEF files.
Determination of Time of Gain and Mode Changes in WBD Normal Mode and Burst Mode 2
Caution must be used when evaluating WBD data that occur at or near any status mode changes of the WBD instrument in its Normal Mode (transmission of data in real time to a Deep Space Network or Panska Ves Observatory ground station). Automatic Gain Control (AGC) gain changes are inserted into the WBD status bit data stream two times per major frame (a major frame consists of 4 minor frames of 39.7 ms each). This is not quite sufficient to guarantee that every gain change status is correctly associated with the time at which the gain change actually took place, especially when the gain update rate has been set to 0.1 s, which is the mode used almost exclusively since late 2001. However, any mismatched gain change will occur only infrequently, and result in amplitudes for single minor frames that are in error by at most 5 dB (a factor of two), which is the major contribution to the overall error associated with determination of wave amplitude.
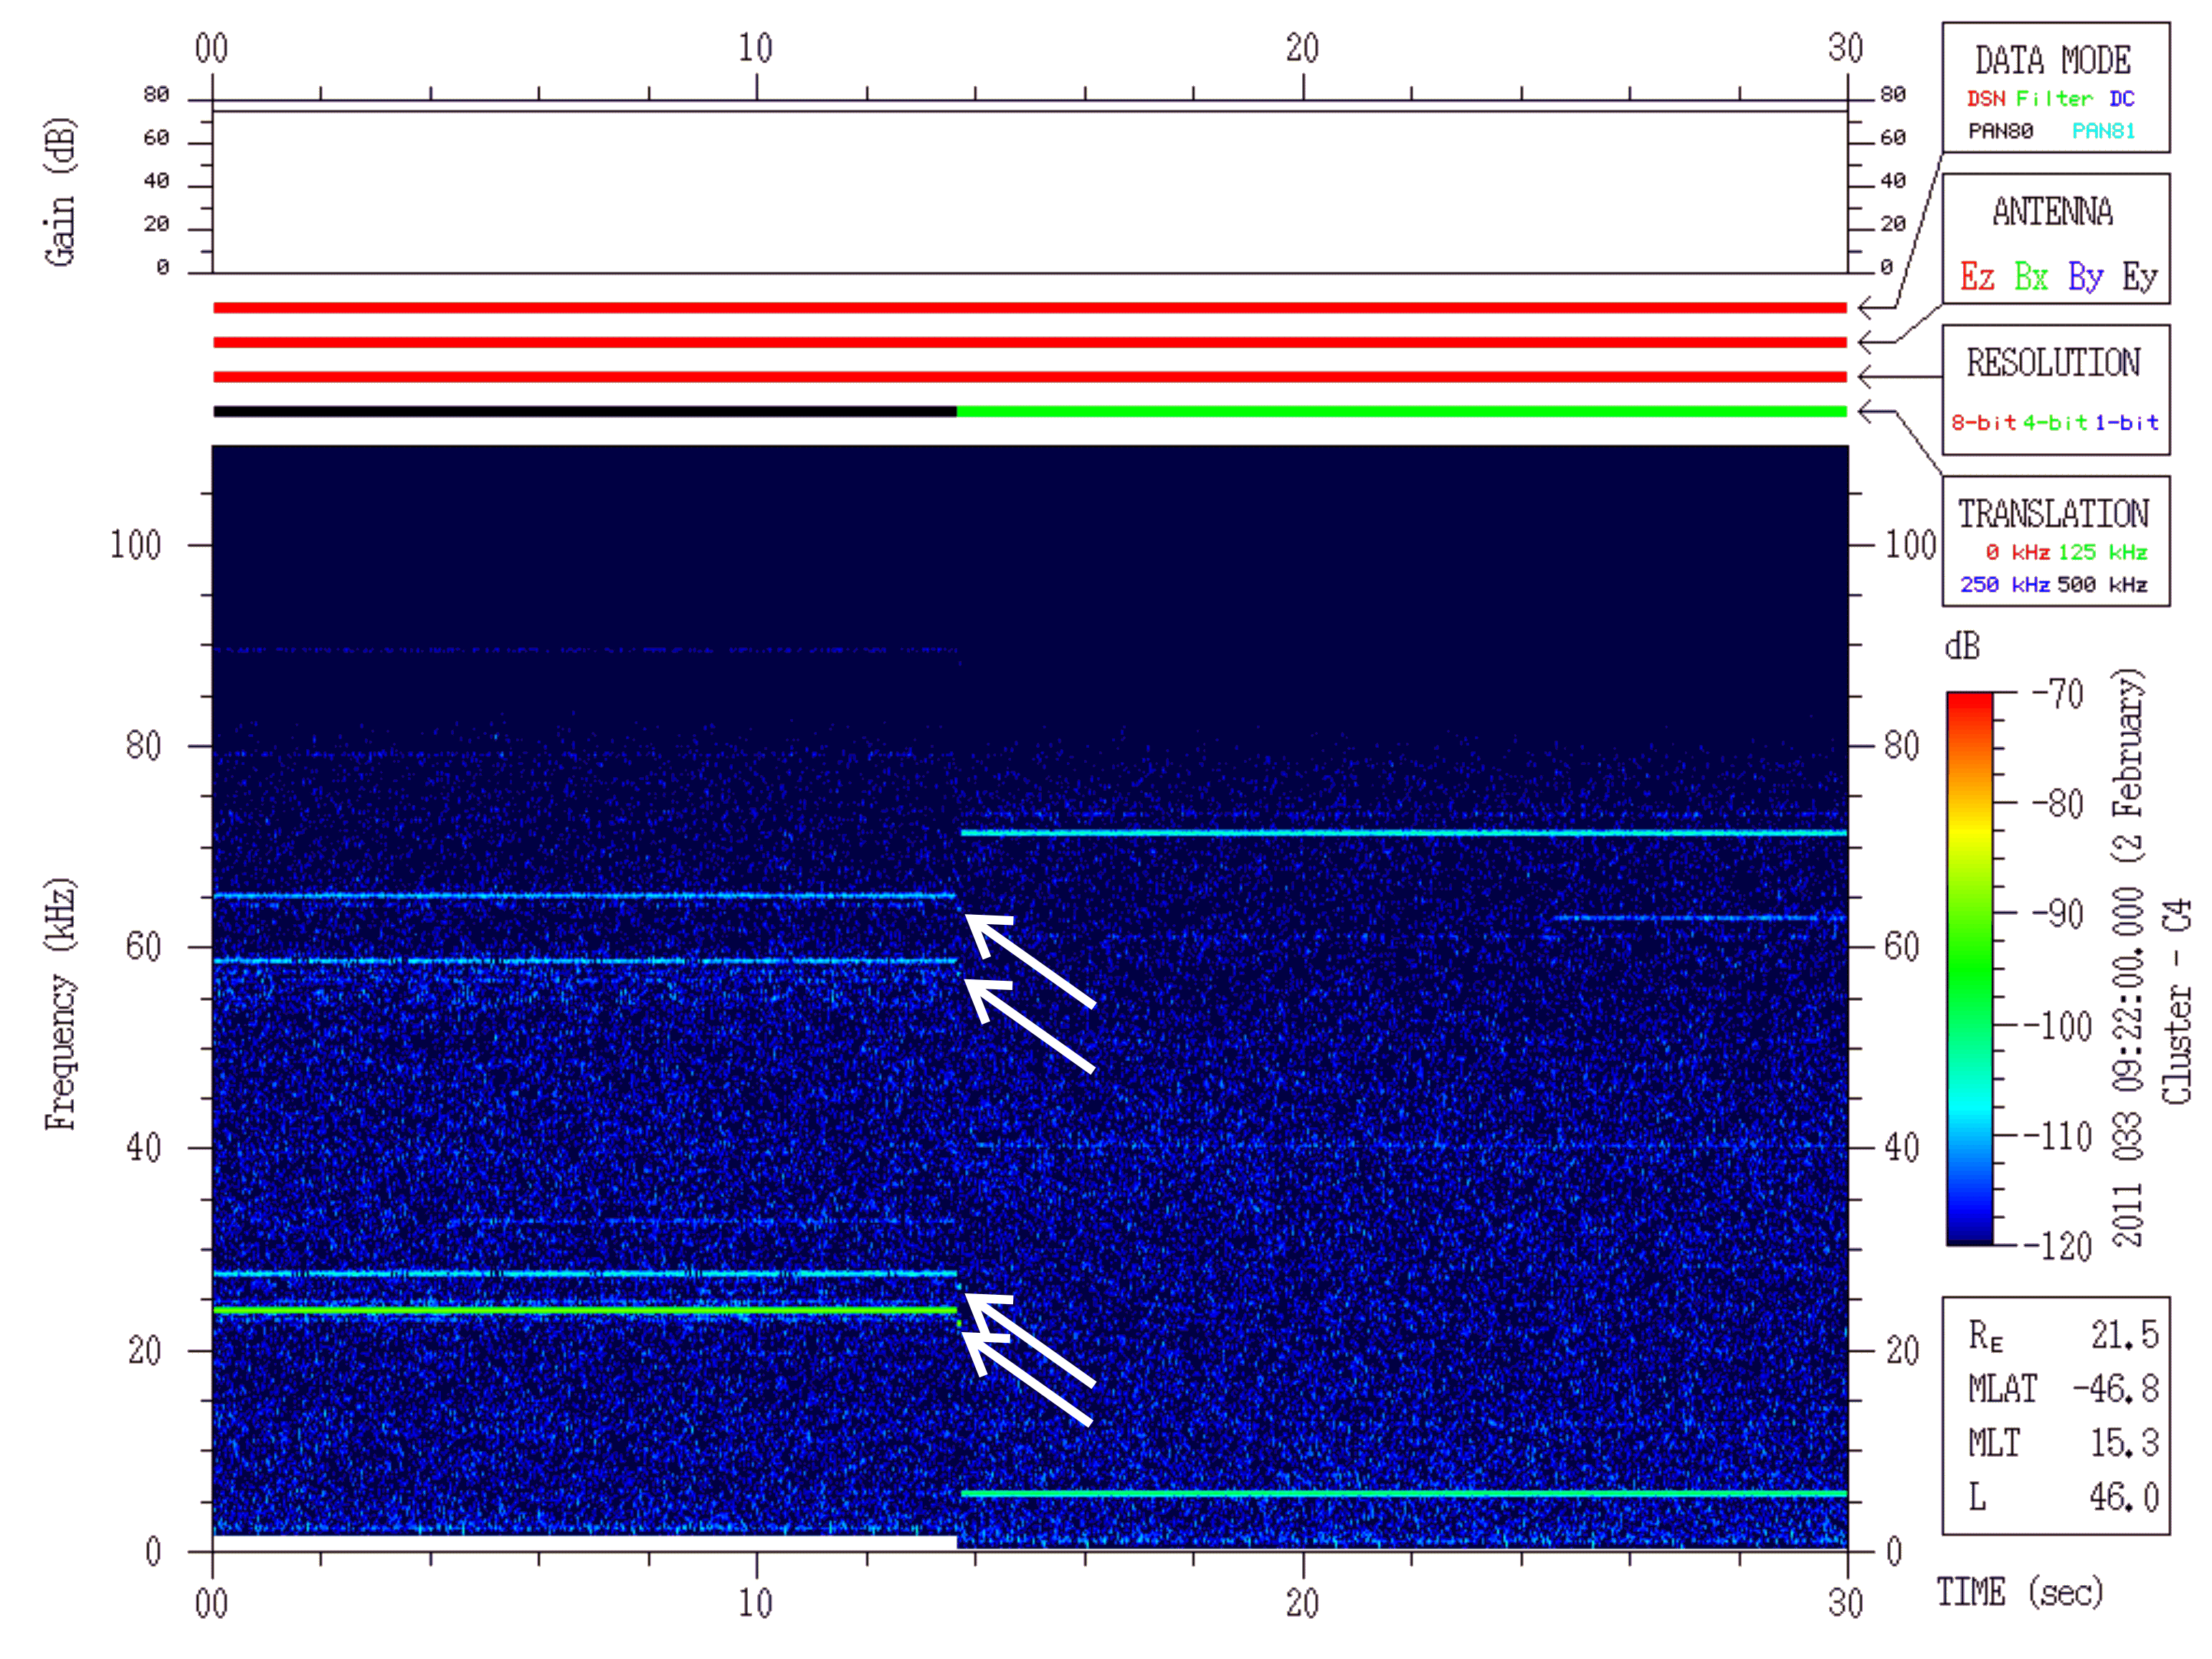
In addition, all the other status bits (antenna, bandwidth, conversion mode, data resolution) are reported only once per major frame, making it possible for a change to actually take place in one minor frame but reported earlier or later by up to three minor frames depending on when the change occurred in relation to when that status byte was sampled in the major frame. Thus, there is the possibility that the mode reported/shown during times of mode changes could be in error by up to 119.1 ms (3 minor frames). An example of this can be seen in Figure 2 below, where the mode switch from the 500 kHz conversion mode to the 125 kHz conversion mode (fourth horizontal bar in the middle panel going from black to green) appears to have been reported in the status bits as occurring at least one to three minor frames before the mode switch actually took place. This is obvious from the interference lines seen at the start of the plot at about 24, 27, 58 and 65 kHz as seen on the left vertical scale (which are actually 524, 527, 558, and 565 kHz when the 500 kHz conversion frequency is added) shifting down to slightly lower frequencies at about the 12 s mark on the horizontal axis. The interference lines observed before the shift down in frequency are the same ones as observed after the shift since their frequencies do not change. This implies that the status bits reported a premature switch in conversion mode by up to three minor frames. This shift down in frequency is also consistent with the shift down of the entire spectrum seen around 0-2 kHz at the 12s mark. The entire spectrum shifts down due to the different frequency calibration for 500 kHz vs. 125 kHz.
In addition to Normal Mode, WBD data are occasionally obtained in Burst Mode 2 (BM2). In BM2, the WBD data are processed by the Digital Wave Processor (DWP) and stored onboard with other Cluster data for later transmission to an ESA ground station. In BM2 the WBD science data are processed by the DWP separately from the WBD status bits, which are embedded in the Wave Experiment Consortium (WEC) housekeeping telemetry (HK) data. Because of this, the transmission of the WBD status information in the HK data stream is delayed (~5s) relative to the WBD science data due to the buffering of the low rate HK stream. Normally, this will not matter because ground processing programs sort out this delay and merge the two data streams (WBD science and WBD status bits) at the correct times (plus or minus 1 WBD minor frame, i.e., 39.7 ms). However, when WBD is operated in BM2 with Whisper data (active and passive) being obtained for a few seconds out of every minute, there is a gap in the WBD data created when Whisper data are being obtained. When the DWP switches over to Whisper, the buffered WBD status data are lost as that part of the HK telemetry is then assigned to Whisper. Thus, the gain and other status information for the last few seconds before the switch are lost, the exact length of this loss depending on when the switch occurred relative to the 5.15s HK data acquisition interval. For the WBD data obtained just before the Whisper data period, rather than insert the WBD status information obtained during the Whisper data period, the WBD team has decided it would be better to hold the last WBD status values (gain, antenna, bandwidth, conversion mode, data resolution) obtained before the switch and apply those values to the last few seconds of data before the gap created by the Whisper data period. The reason it is better to use the status information before the Whisper data period rather than during it is primarily because the WBD mode is changed during the Whisper data taking period, leading to significant differences in the gain set by WBD's AGC system in response to wave amplitudes at different frequencies or observed with different antennas. Thus applying the last values of the WBD status bits just before the switch to Whisper provides a closer approximation of the actual status during those last few seconds before the gap where the actual status values have been lost.
However, the AGC gain values can also be greatly affected by bursty and spin-modulated natural waves. Thus, using the last good values of the status bits obtained outside Whisper data taking periods for the last few seconds (variable up to ~5s) prior to the Whisper data taking period leads to some incorrect, and not deterministic, gain values as can be seen in Figures 3 and 4 below. Figure 3 clearly shows in the top panel the last gain value obtained before the gap, 35 dB, applied to the maximum ~5s up to the time of the gap. In addition it can be seen that because the wave emissions are spin modulated (stronger emissions during part of the spin depending on orientation of the antenna with respect to the propagation direction of the emission), causing the AGC to cycle between two different values of gain at half the spin rate (~2s), the amplitudes shown for the waves during parts of the spin period where the waves are weaker are calibrated to be too large because the calibration of the amplitudes depends on the gain. This same effect can be seen in Figure 4 where the last gain of 55 dB is inserted for a shorter period before the gap (~4s). If it is necessary to use these data close to the Whisper gap and it is clear that the AGC is cycling up and down in relation to the directionality of the waves, an attempt could be made by the researcher to adjust the amplitudes by assuming that the gain is cycling at half the spin period as seen at the start of both Figures 3 and 4. In order to do this, the researcher should refer to the WBD Calibration Report to see how the gain is applied in the calibration and making the appropriate adjustments for gain cycling at the half spin period. If this is done, it needs to be noted that there is greater error in the amplitude measurements for these few seconds of data when compared to all other data periods.
Ten-Second Data Gaps Associated with Corrupted WBD Data
Soon after mission operations began, the WBD team discovered that the OBDH system occasionally delivers WBD data for transmission to the ground which have been corrupted. These corruptions are usually approximately 10 seconds long and affect the electric field data. An example of the corruption is shown in Figure 5 starting at around 08:11:22 UT. This is a typical case, where vertical stripes of mostly dark blue alternating with more intense stripes containing red and green at half the spin period are observed. Most of these data corruptions are recognized during initial processing of the WBD data. Since there is no way to recover the actual data, WBD removes these data records from the file resulting in a data gap. Almost all of these data gaps are ~ 10 s long so data gaps of this length have a large possibility of being caused by this data corruption. The corruptions are observed almost always on Cluster 1 and Cluster 3, and almost never on Cluster 2 or Cluster 4. The WBD team points out this problem in this caveat file for the sole reason that there is a slight possibility that one of these corruptions could have been missed in the processing of the data because it presented in a slightly different manner. Thus, the users of WBD data should familiarize themselves with this problem and be cautious of strange looking data, such as seen in Figure 5, which persists for ~ 10 s. The cause of this data corruption is unknown, but is believed to be due to some type of saturation within the data chain.
pickett@uiowa.edu, project PI