|
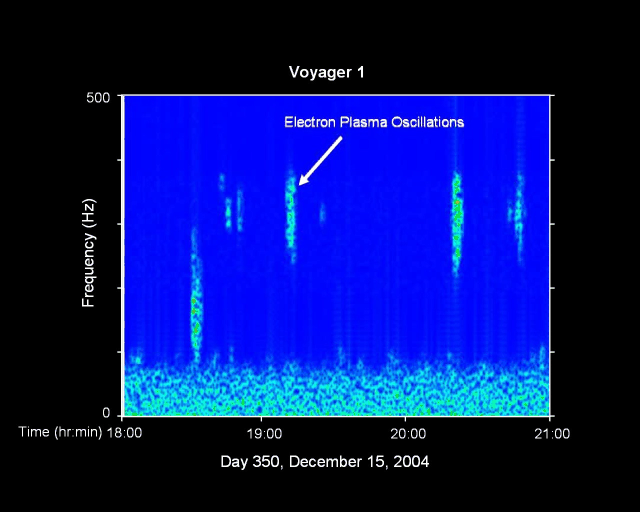
| Figure 1. Frequency-time spectrogram showing plasma oscillations preceding termination shock crossing. |
|
|
|
|
|
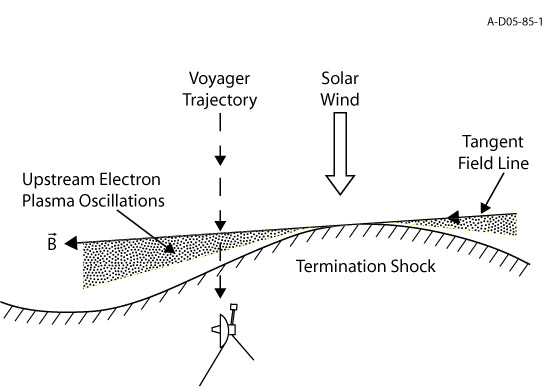
| Figure 2. Geometry of the termination shock crossing. |
|
Figure 1 above is a frequency-time spectrogram showing plasma oscillations detected near the termination shock by the Voyager 1 plasma wave instrument. The spectrogram covers an interval of three hours, from 18:00 to 21:00 on Dec 15, 2004. In the audio sound file this interval has been compressed to 6 seconds. Figure 2 above shows the likely geometry of the termination shock during the crossing on December 16, 2004. As the spacecraft approached the shock (indicated by the dashed lines), it encountered a magnetic field line that is tangent to a small ripple in the shock front. An electron beam escaping from the shock along the tangent magnetic field line caused the electron plasma oscillations shown in Figure 1. Shortly after that, on December 16, the spacecraft passed through the termination shock. Don GurnettPrincipal Investigator of the Voyager PWS |