Musical Tones from Juno Waves Perijove 4
This video requires flash or html5.
![]() Play audio (122.9 seconds)
Play audio (122.9 seconds)
![]() Play audio (122.9 seconds)
Play audio (122.9 seconds)
|
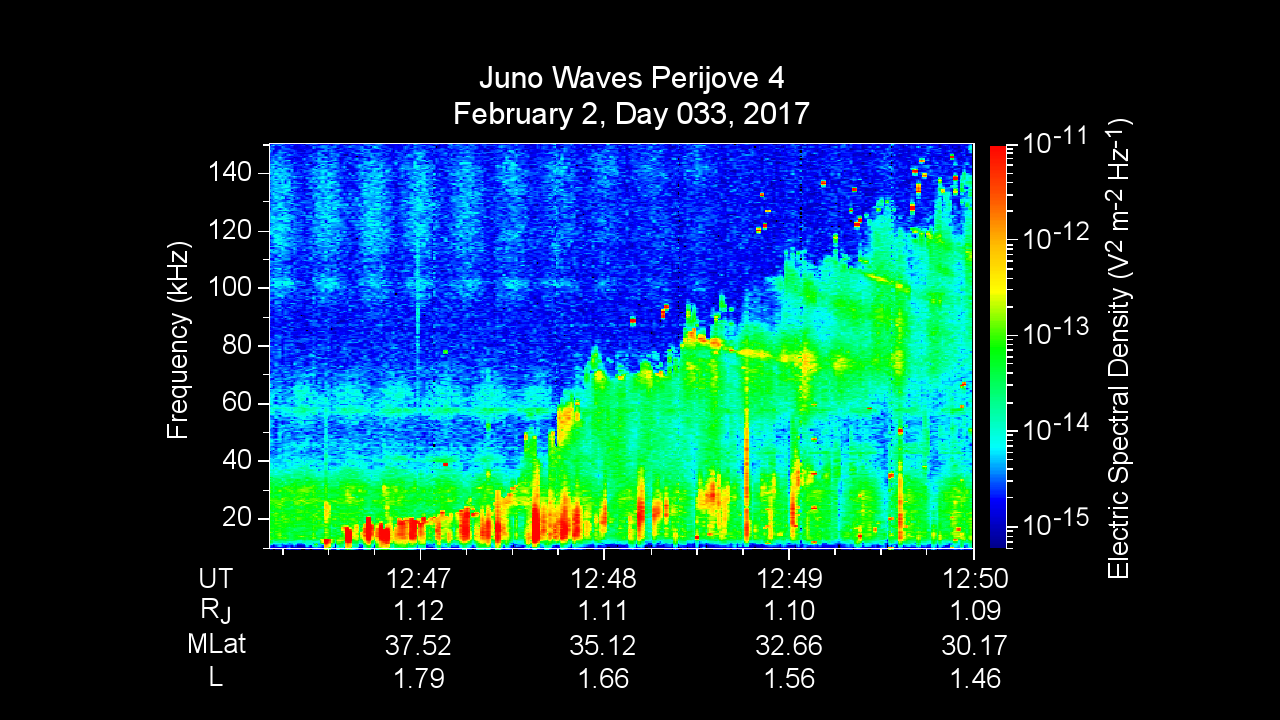
NASA's Juno spacecraft has observed plasma wave signals from Jupiter's ionosphere. This display is a frequency-time spectrogram. The results in this figure show an increasing plasma density as Juno descended into Jupiter's ionosphere during its close pass by Jupiter on February 2, 2017. The intensity, or amplitude, of the waves is displayed based on the color scale shown on the right. The actual observed frequencies of these emissions approach 150 kHz, which is above the human hearing range. To bring these signals into the human audio range, the playback speed has been slowed by a factor of about 60. The momentary, nearly pure tones follow a scale related to the electron density, and are likely associated with an interaction between the Juno spacecraft and the charged particles in Jupiter's ionosphere. The exact source of these discrete tones is currently being investigated. Credit: NASA/JPL-Caltech/SwRI/Univ. of Iowa The video presents a frequency-time spectrogram with a moving cursor that shows the time position of the audio track. Time advances from left to right along the horizontal axis, frequency ranges from low to high frequencies along the vertical axes, and the amplitude of the signals is color coded with blue indicating weak signals and red indicating strong signals. View the science results teleconference |
|
on the Web |
on Twitter |
on YouTube |
on FaceBook |
|
© The University of Iowa
2017. Audio clips freely licensed
under a
Creative Commons Attribution 3.0 Unported License Contact information. Send questions or comments to William Kurth. The Radio and Plasma Wave Group, Department of Physics & Astronomy, College of Liberal Arts & Sciences. |
|