 GALILEO
PLASMA WAVE INSTRUMENT
GALILEOTracking data quality and techical issues prior to PDS delivery.
A potentially useful Autoplot Vap for reviewing these data is GOPW_2001-vol_check-v5.vap. The current volume, as it stands, is linked here GOPW_2001.
Time Range strings below are in a format that may be cut and pasted into Autoplot.
The following PDS GOPW_2001 Lien list needs to be addressed before the volume can be re-delivered to the PDS.
Volume processing has only reached the end of SCET day: 2001-10-15 (288).
| ID | Problem | Time Range | Plot |
|---|---|---|---|
| 1996-178_a | Spectrum without densities | 1996-178 | |
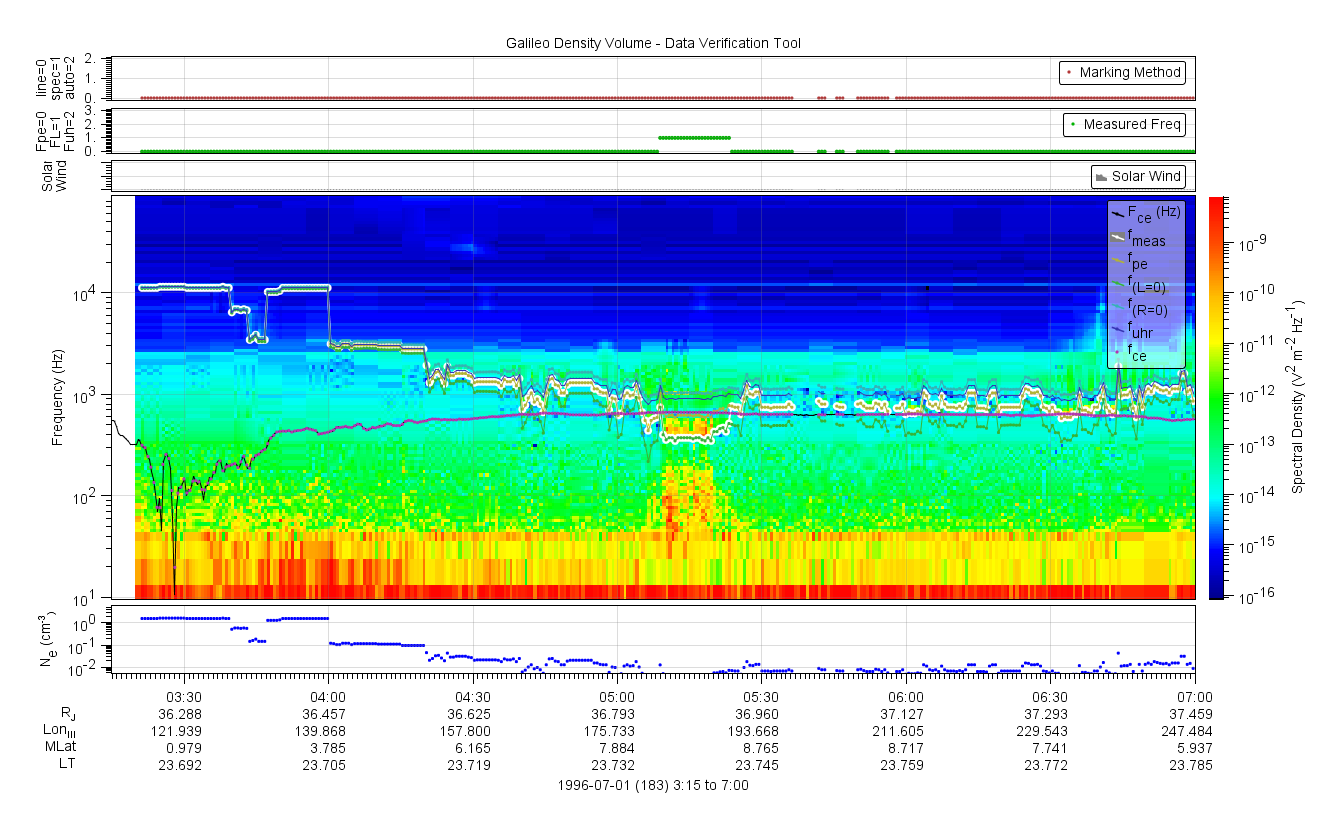
| 1996-183_a | Possible bad data | 1996-183 3:15 to 7:00 | Plot |
| 1996-220_a | Spectrum without densities | 1996-220 | |
| 1996-221_a | Spectrum without densities | 1996-221 | |
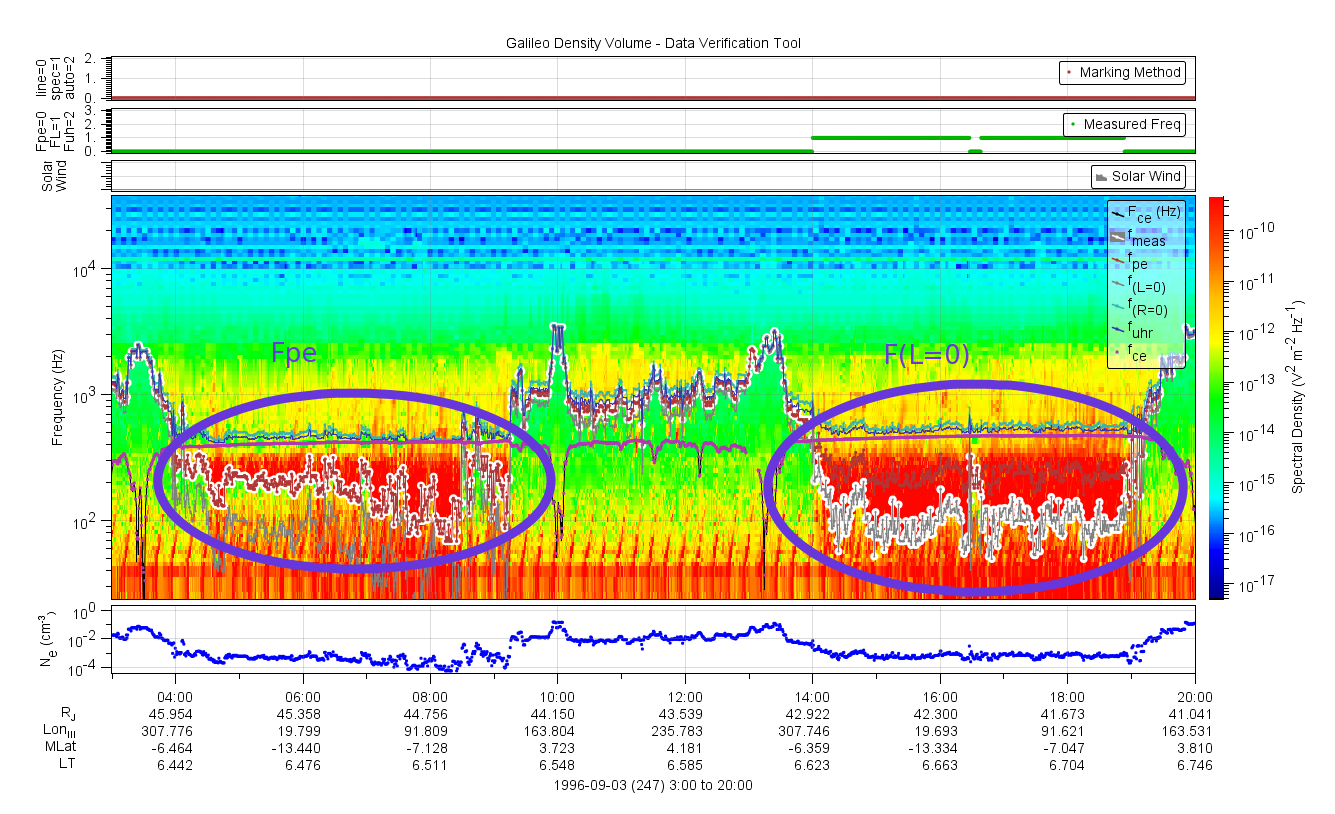
| 1996-247_a | Fpe and F(L=0) usage seems inconsistent | 1996-247 3:00 to 20:00 | Plot |
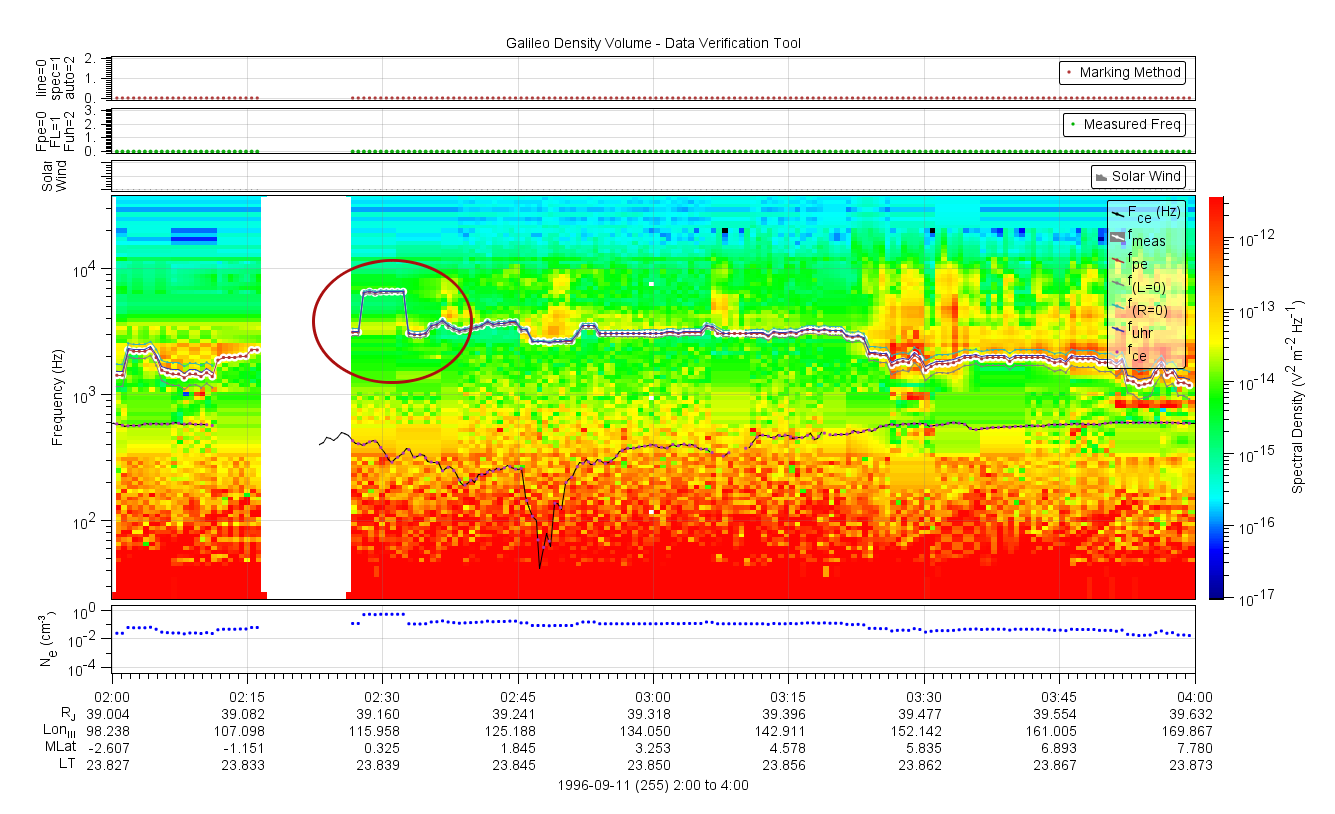
| 1996-255_a | Possible bad data | 1996-255 2:00 to 4:00 | Plot |
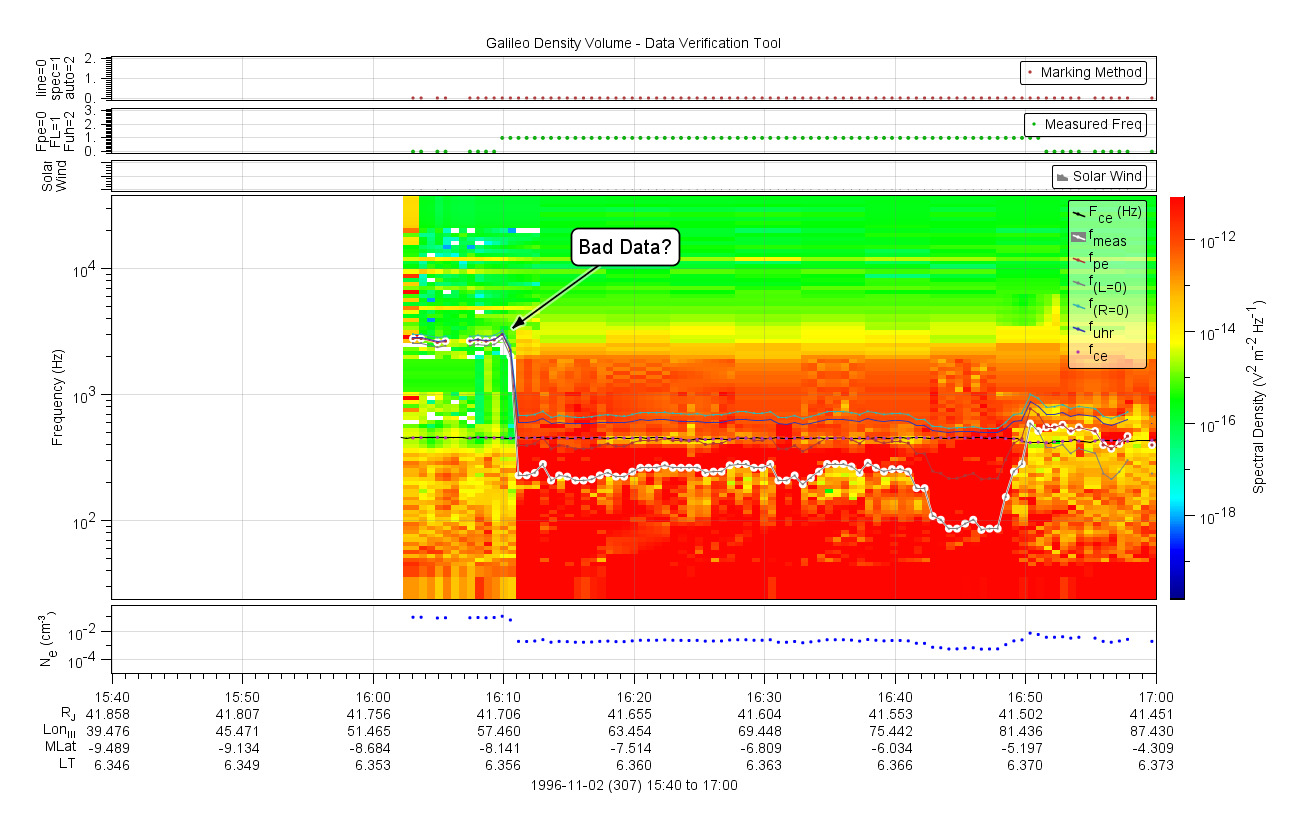
| 1996-307_a | Possible bad data | 1996-307 15:40 to 17:00 | Plot |
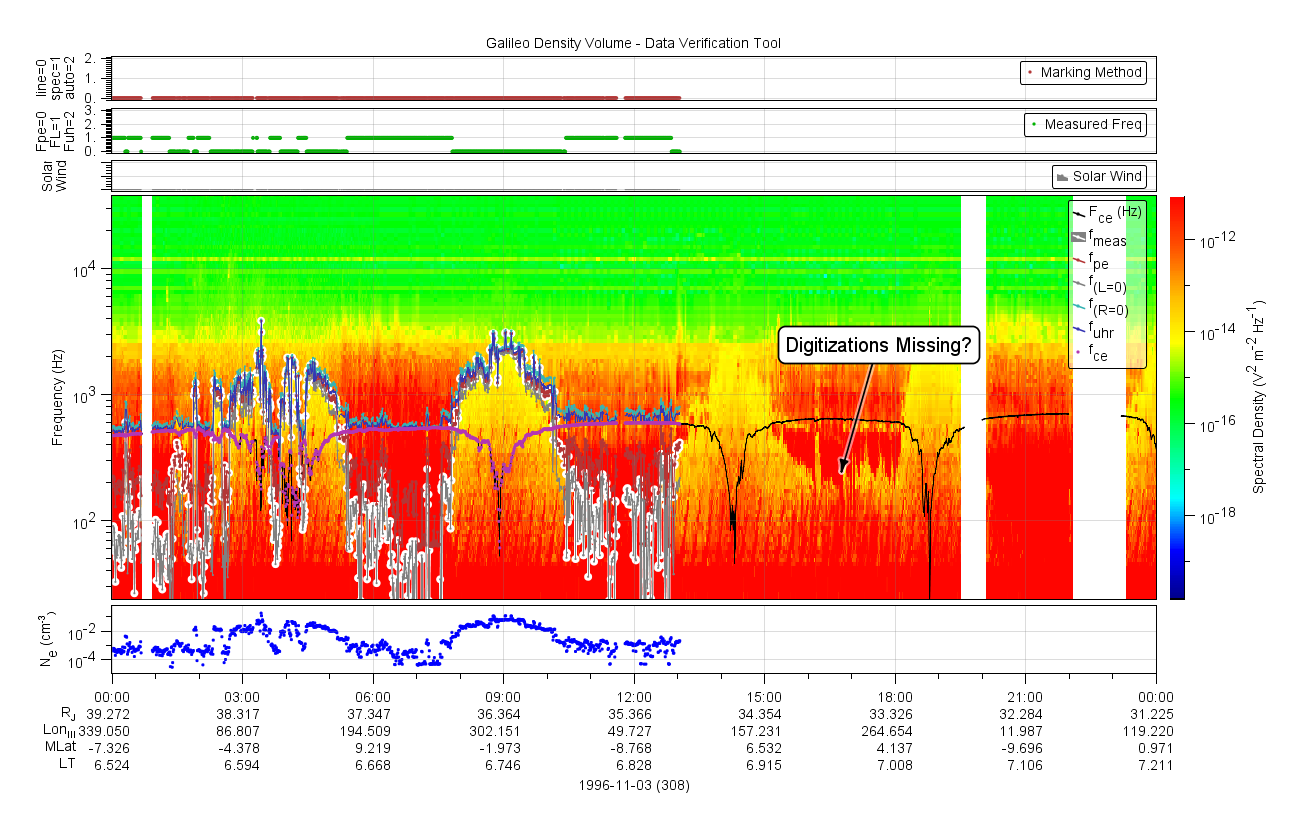
| 1996-308_a | Missing partial day densities? | 1996-308 13:00 to 23:30 | Plot |
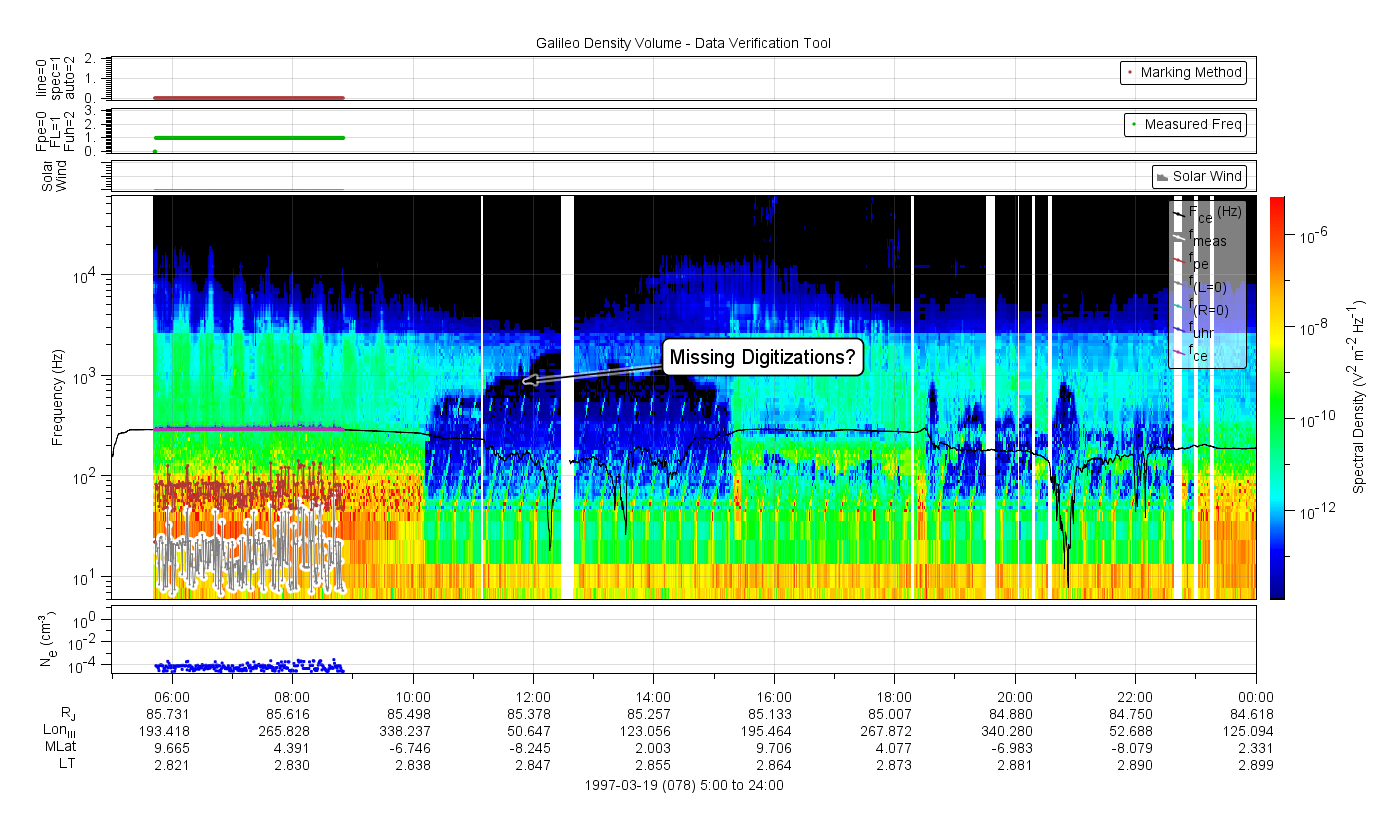
| 1997-078_a | Missing digitized data? | 1996-078 08:00 to 23:30 | Plot |
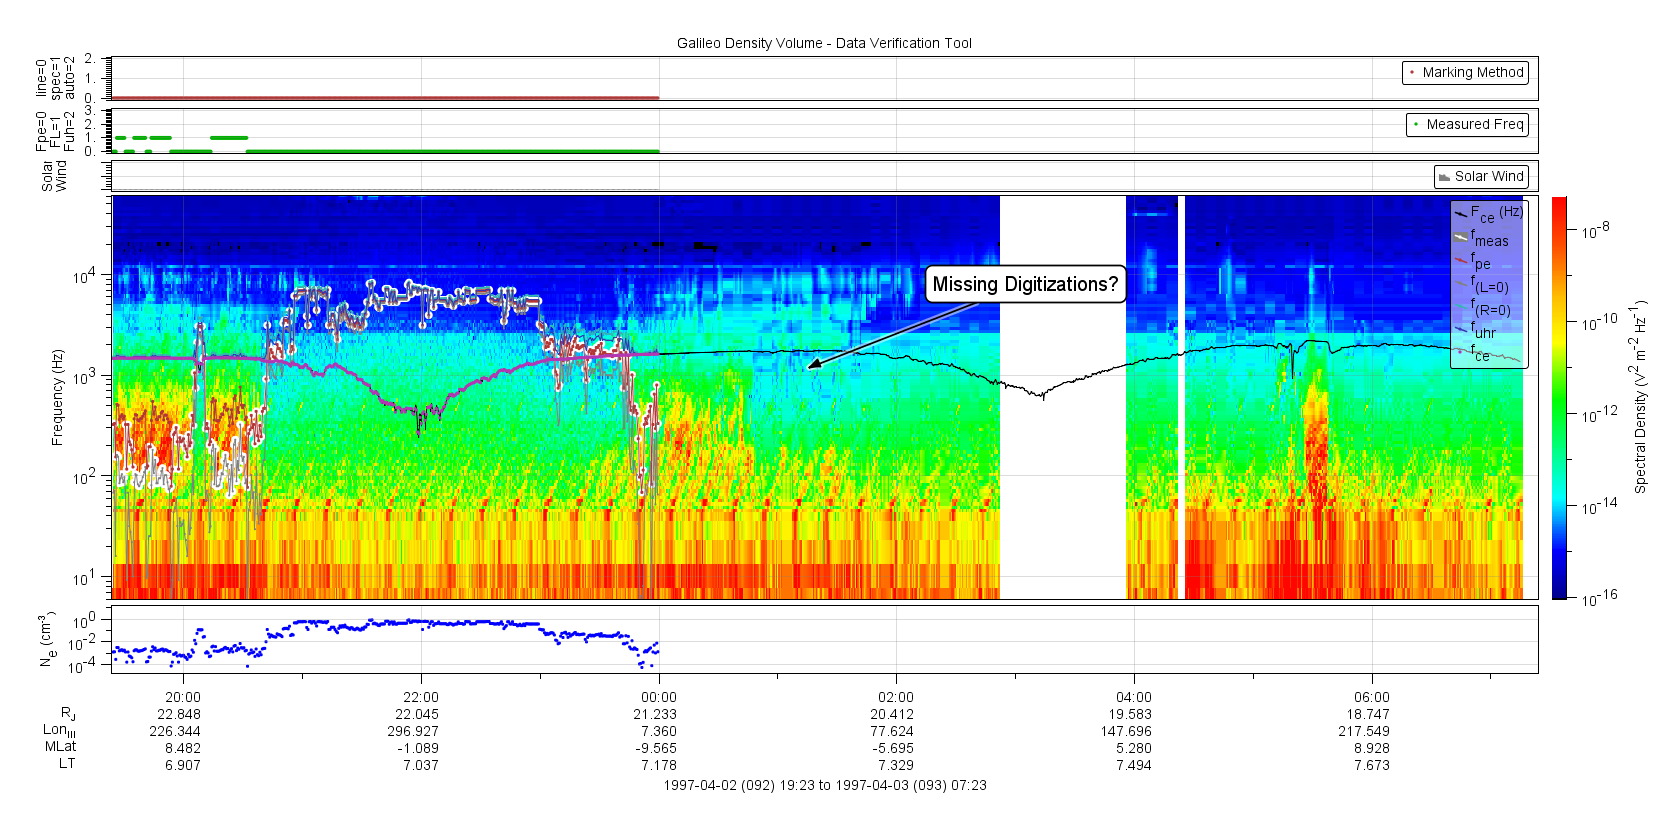
| 1997-093_a | Spectrum without densities | 1997-093 | Plot |
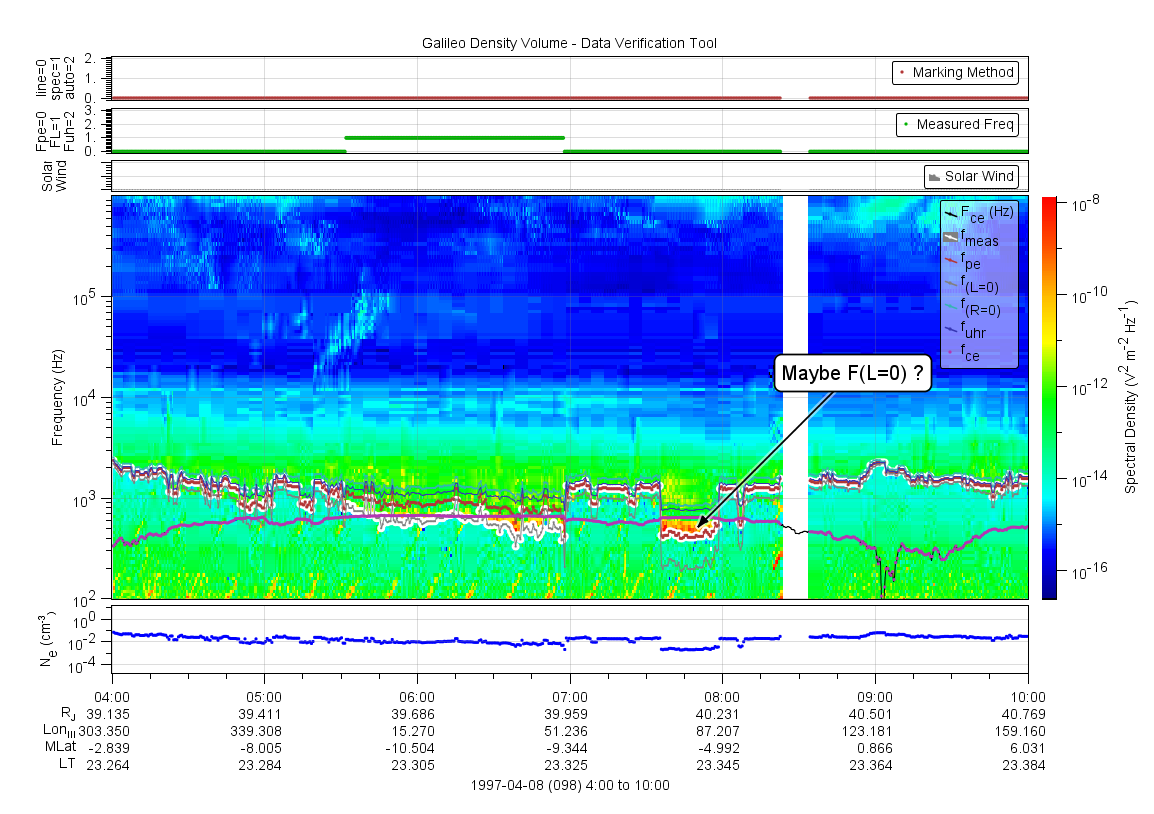
| 1997-098_a | Fpe and F(L=0) usage seem inconsistent | 1997-098 4:00 to 10:00 | Plot |
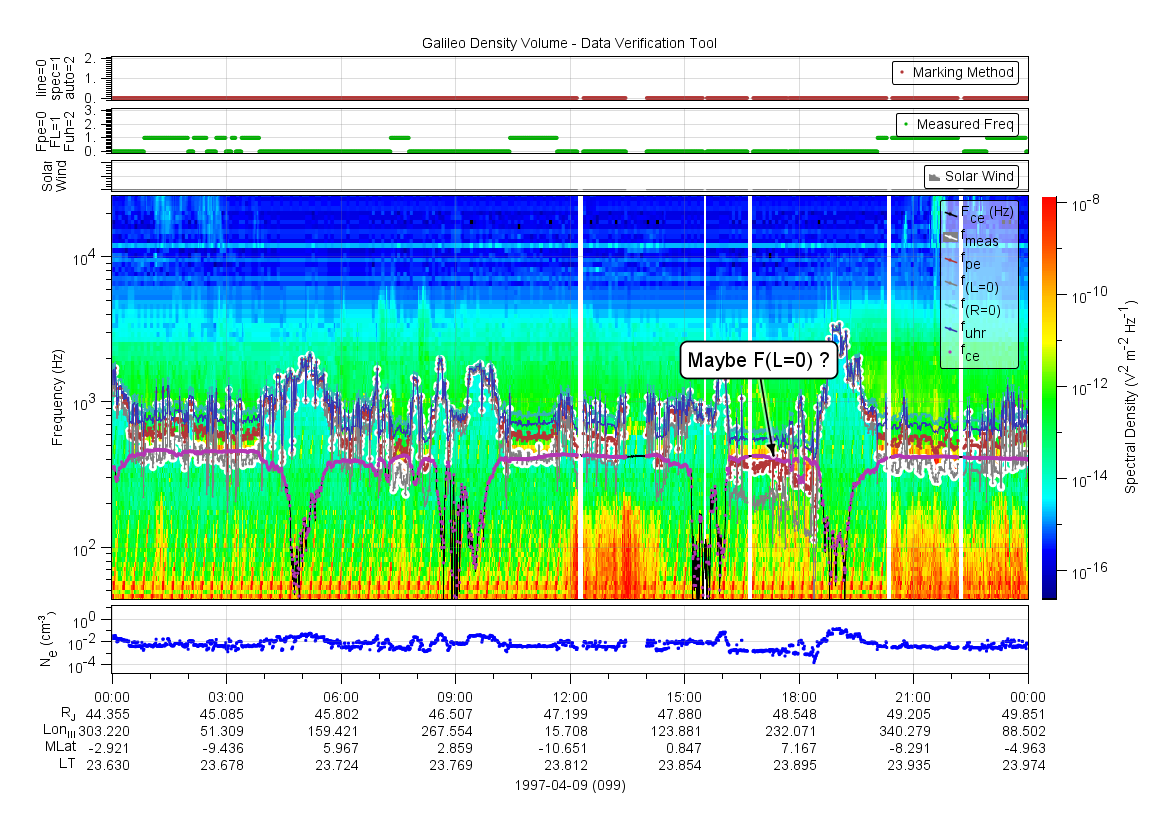
| 1997-099_a | Fpe and F(L=0) usage seems inconsistent | 1997-099 12:00 to 19:00 | Plot |
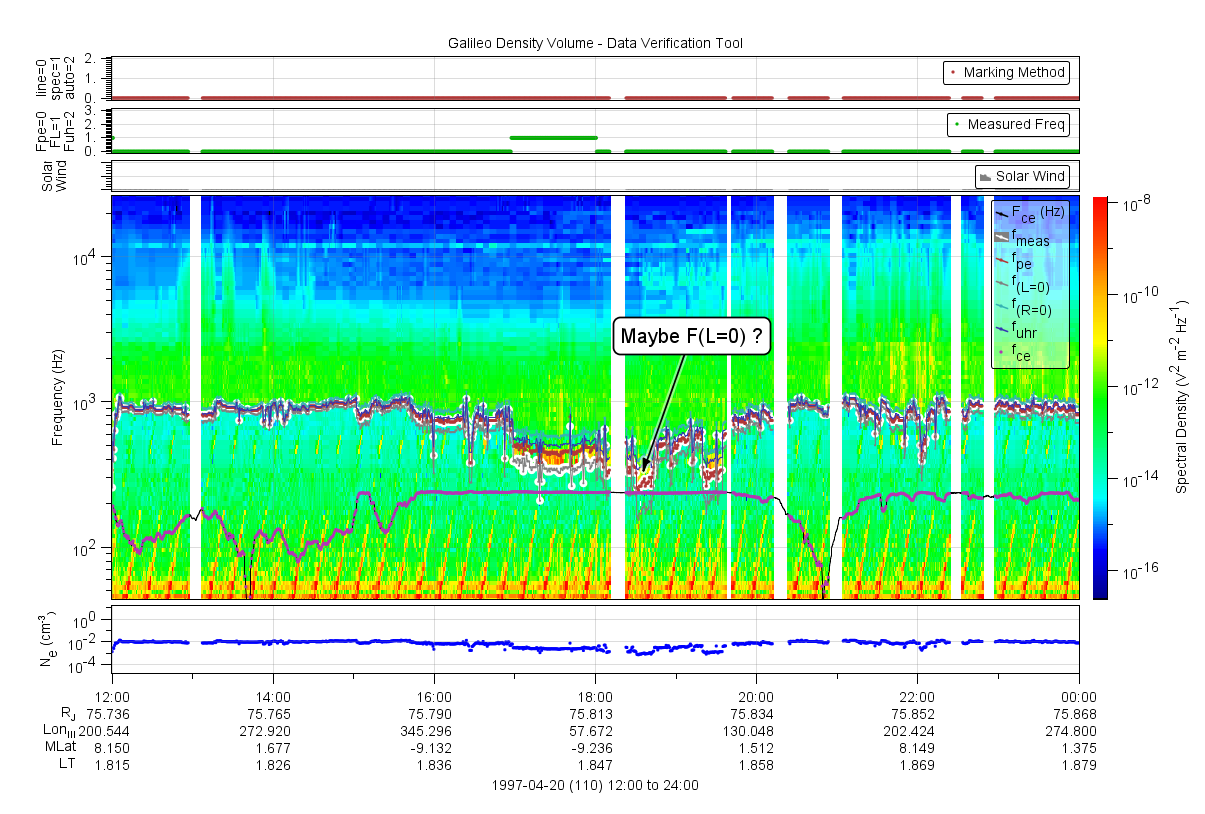
| 1997-110_a | Fpe and F(L=0) usage seems inconsistent | 1997-110 16:00 to 20:00 | Plot |
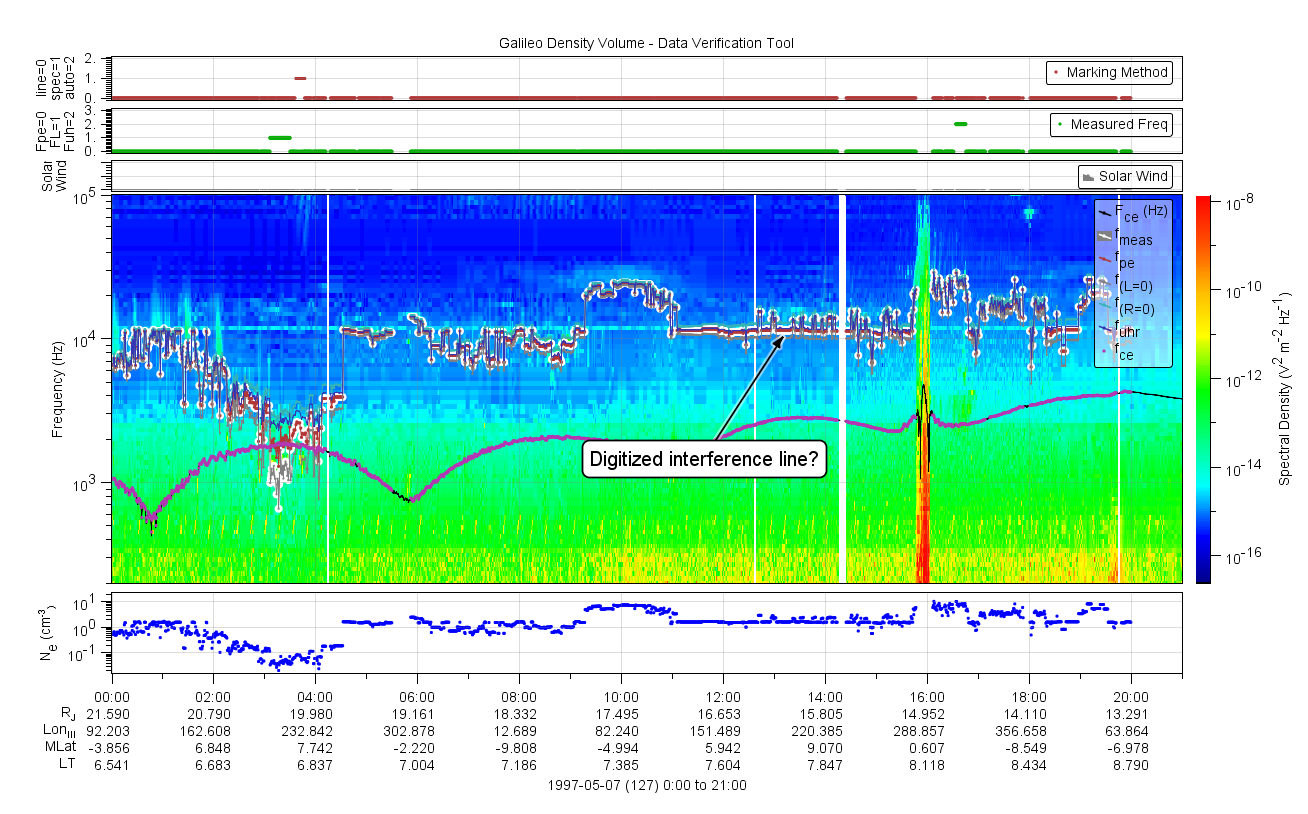
| 1997-127_a | Looks like an interference line was digitized | 1997-127 10:00 to 16:00 | Plot |
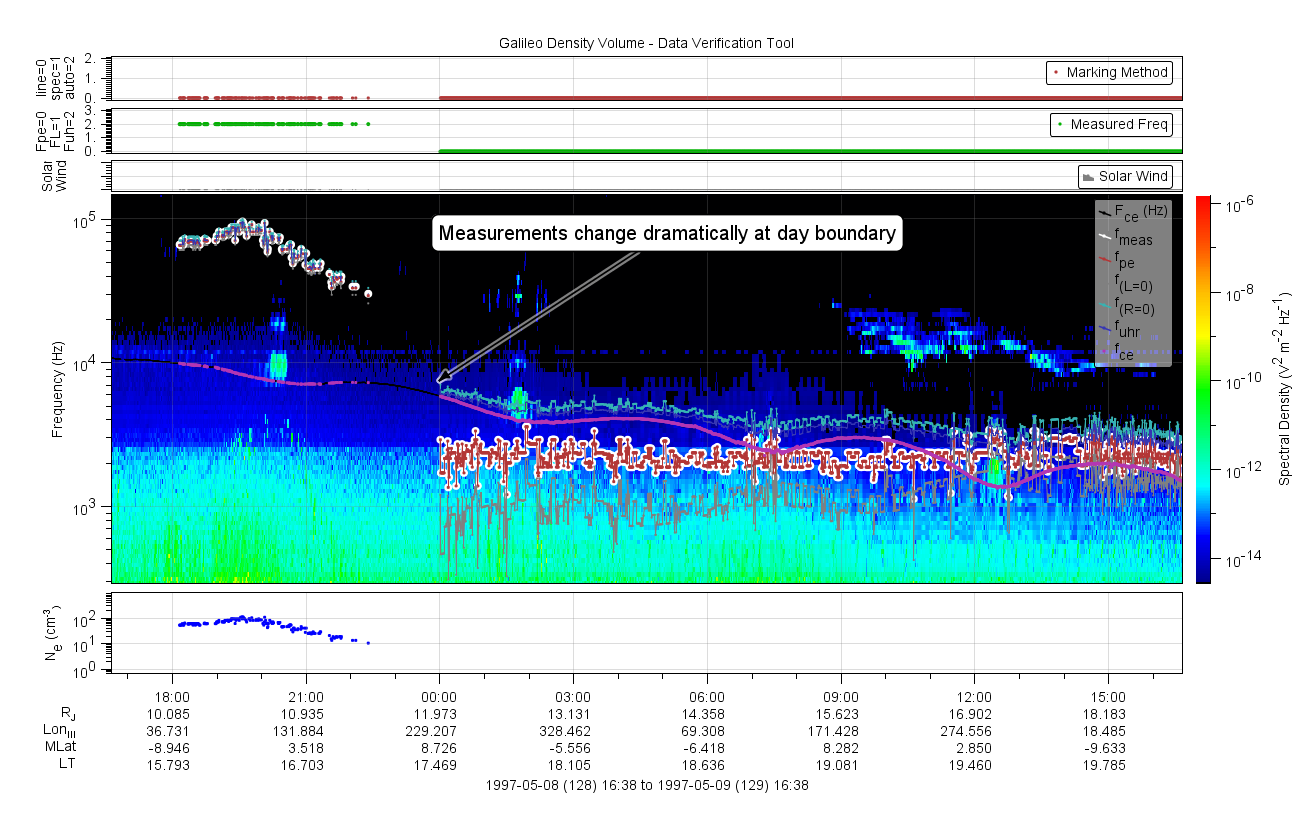
| 1997-129_a | Measurements change dramatically at day boundary | 1997-128T18:00 to 1997-129T12:00 | Plot |
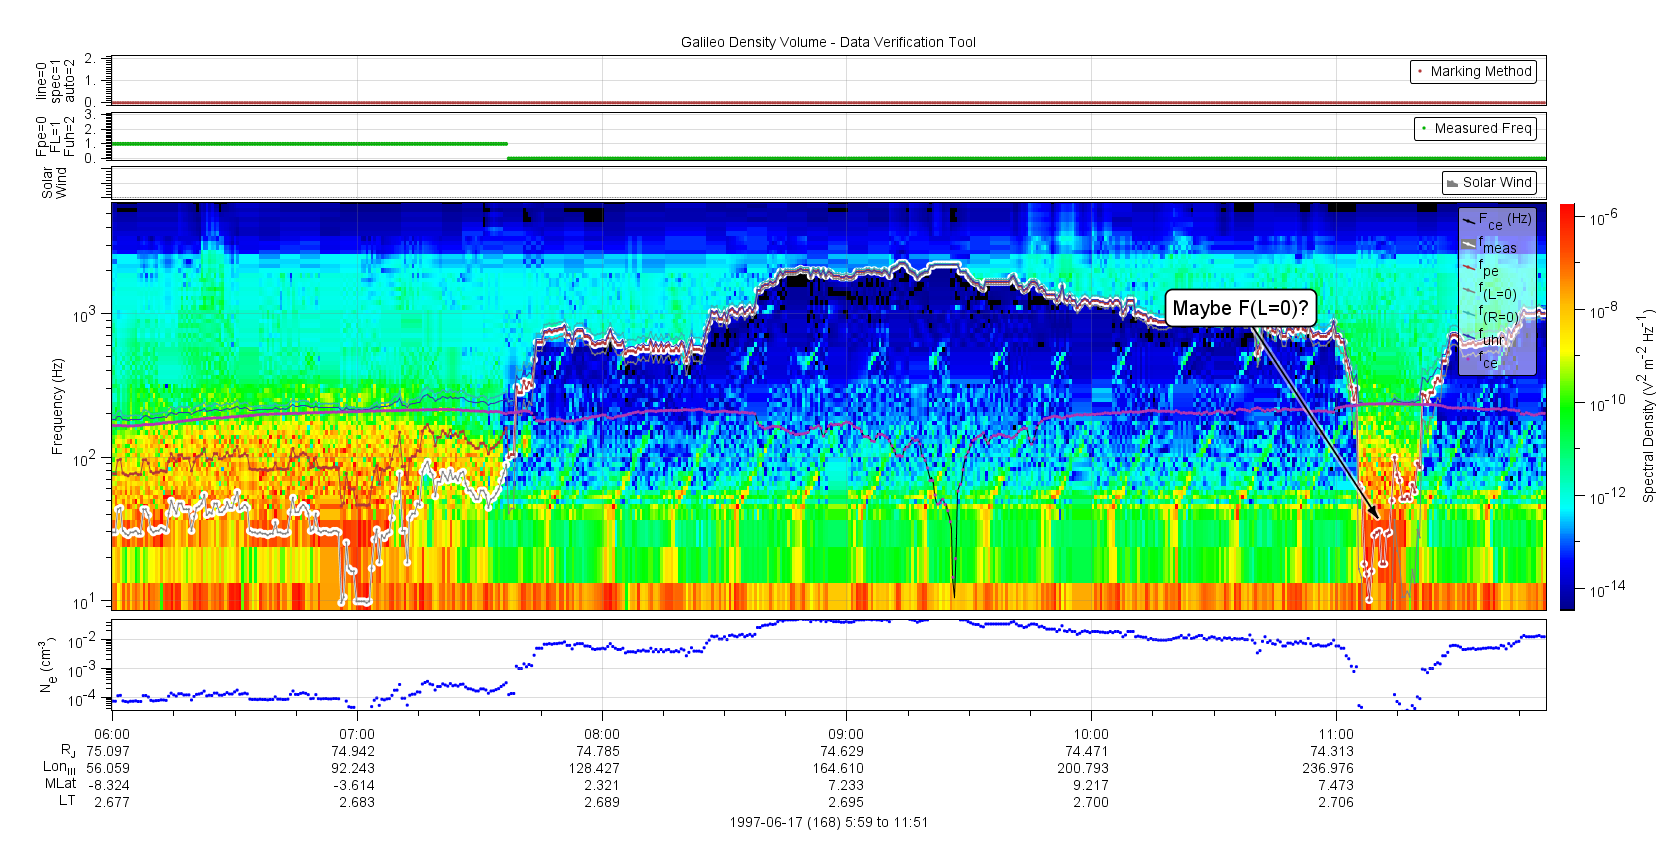
| 1997-168_a | Fpe and F(L=0) usage seems inconsistent | 1997-168 6:00 to 12:00 | Plot |
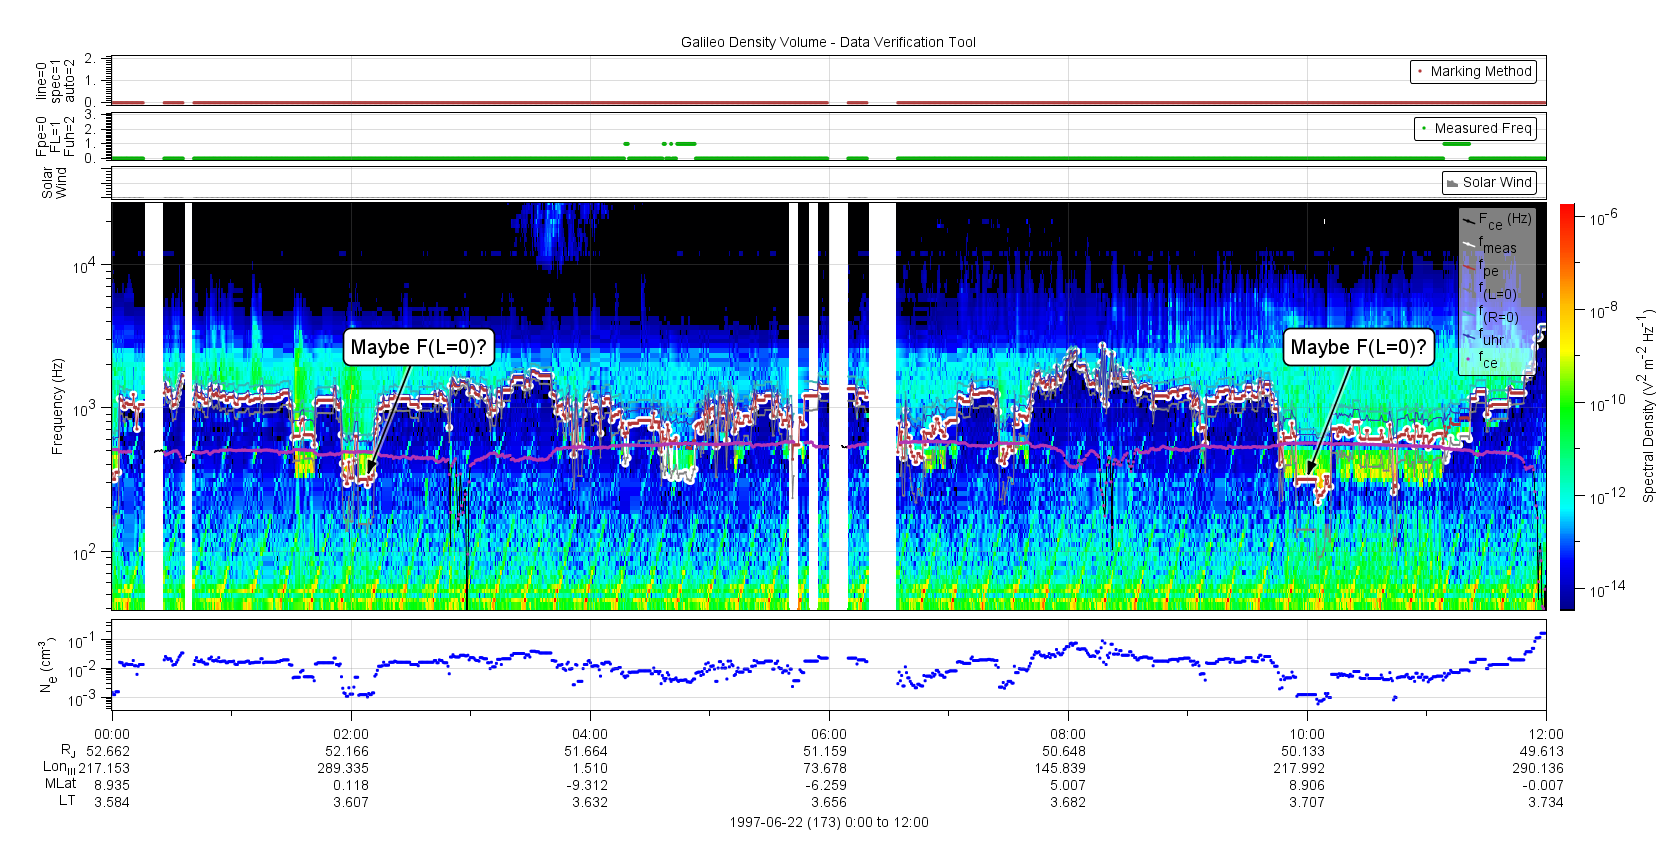
| 1997-173_a | Fpe and F(L=0) usage seems inconsistent | 1997-173 0:00 to 12:00 | Plot |
| 1997-177_a | Spectrum without densities | 1997-177 | |
| 1997-179_a | Spectrum without densities | 1997-179 | |
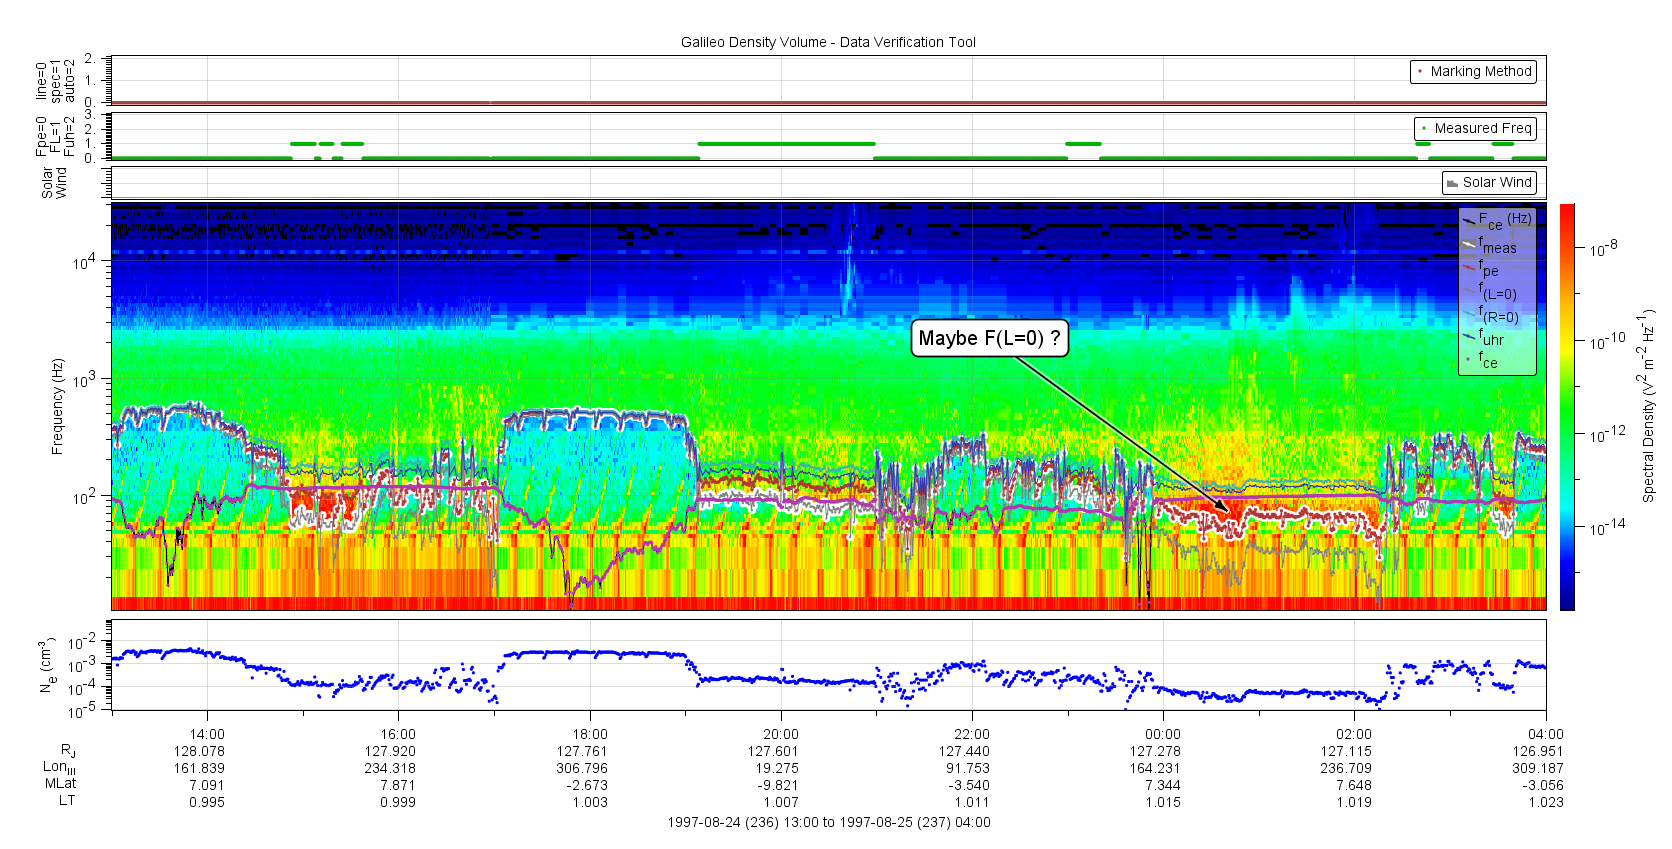
| 1997-237_a | Fpe and F(L=0) usage seems inconsistent | 1997-236T13:00 to 1996-237T04:00 | Plot |
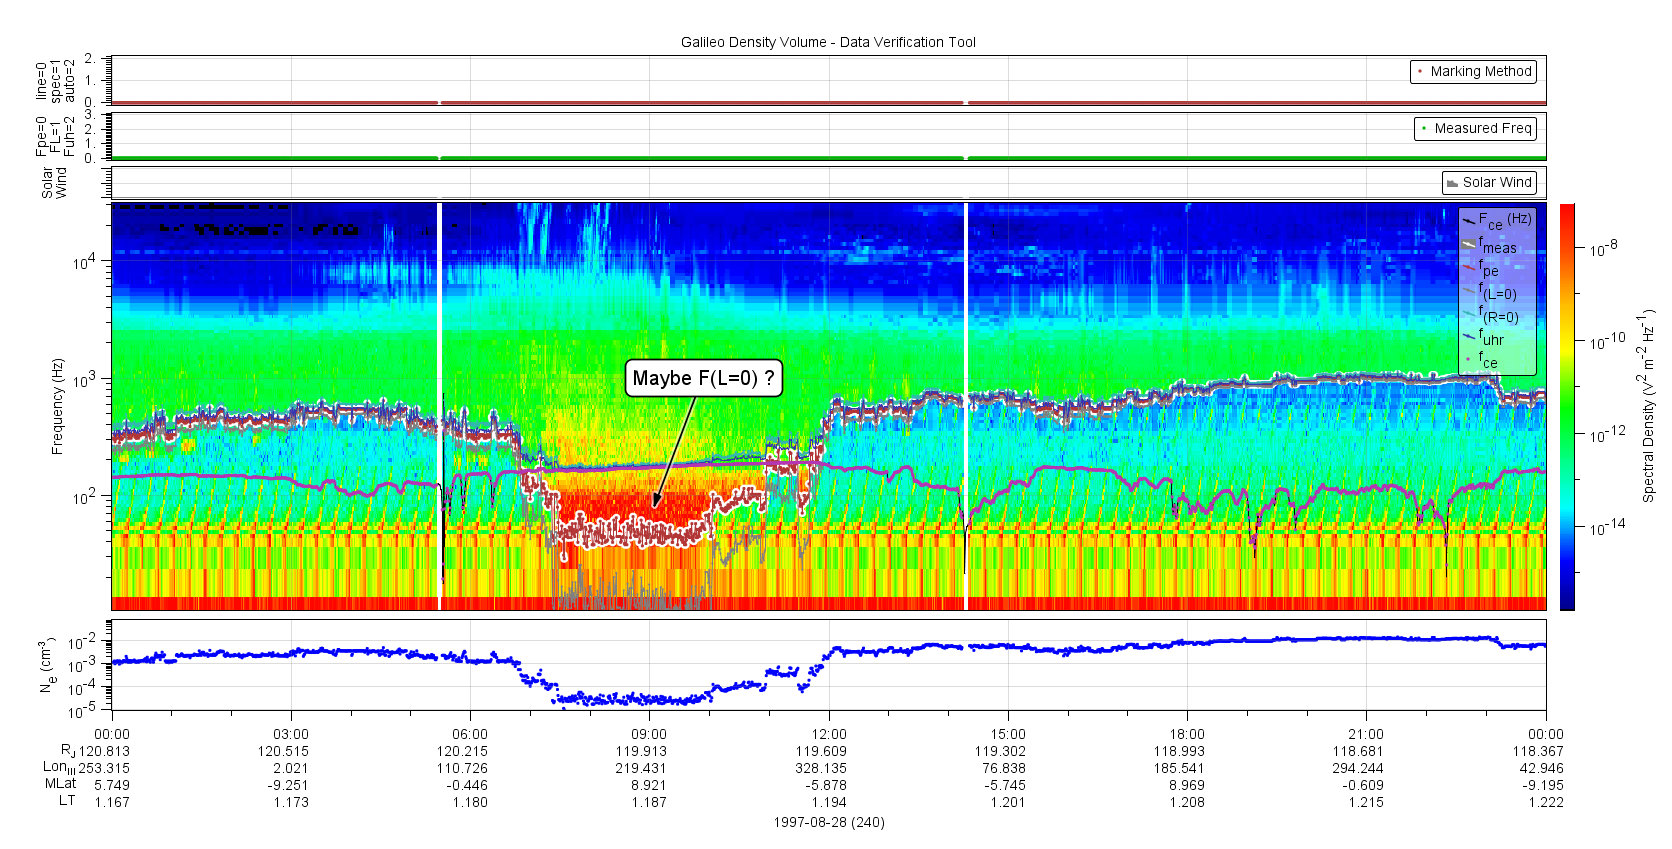
| 1997-240_a | Fpe and F(L=0) usage seems inconsistent | 1997-240T06:00 to 1996-240T12:00 | Plot |
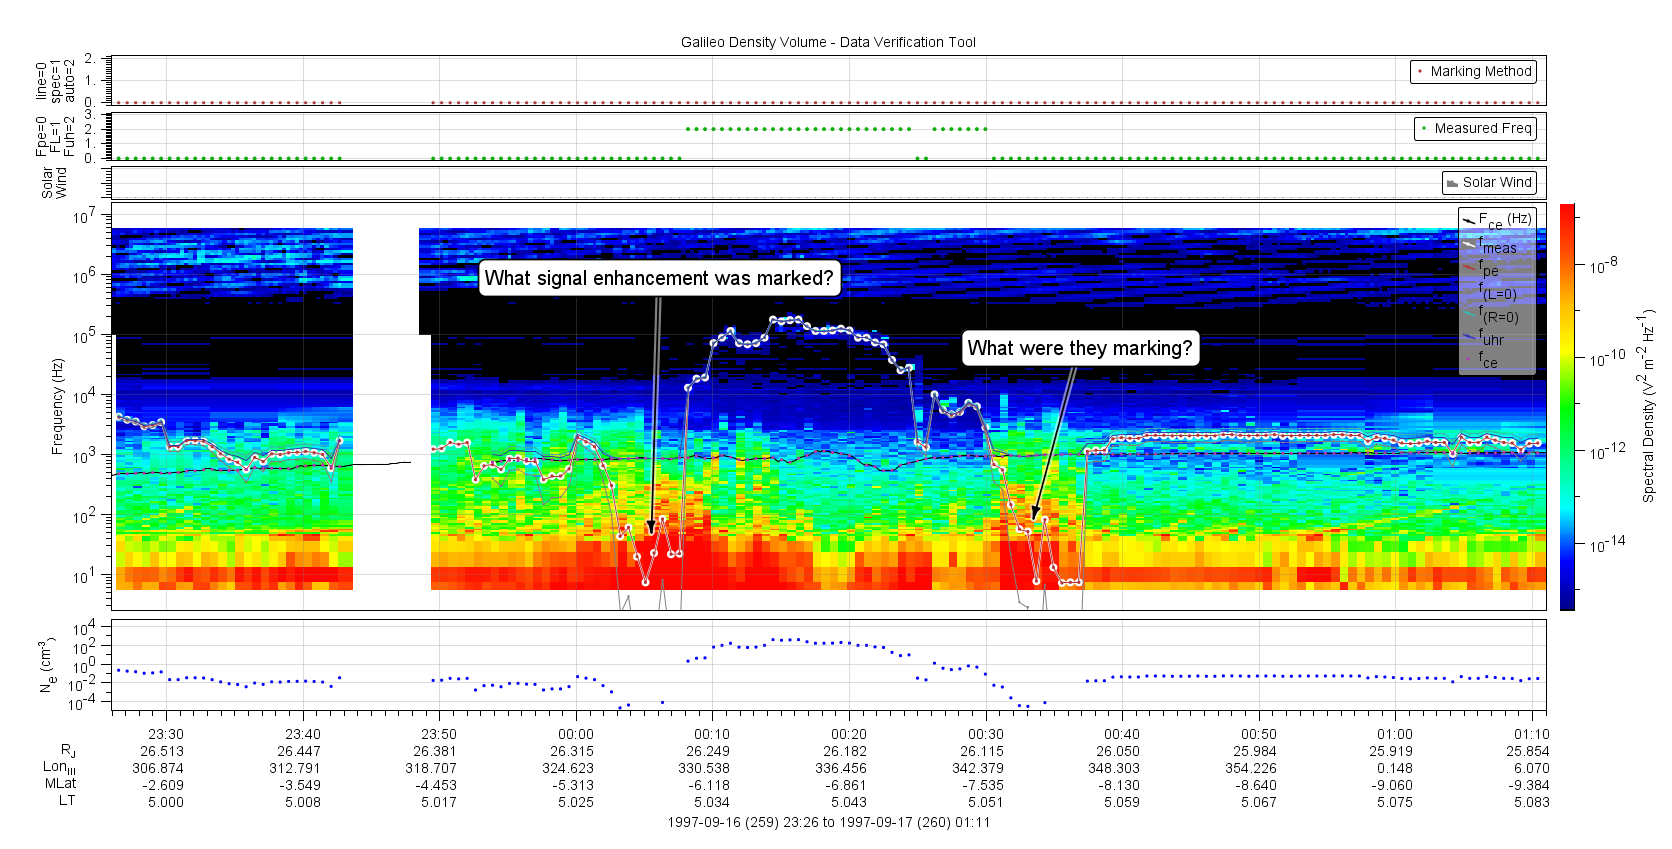
| 1997-260_a | Can't tell what feature was marked | 1997-260 0:00 to 1:00 | Plot |
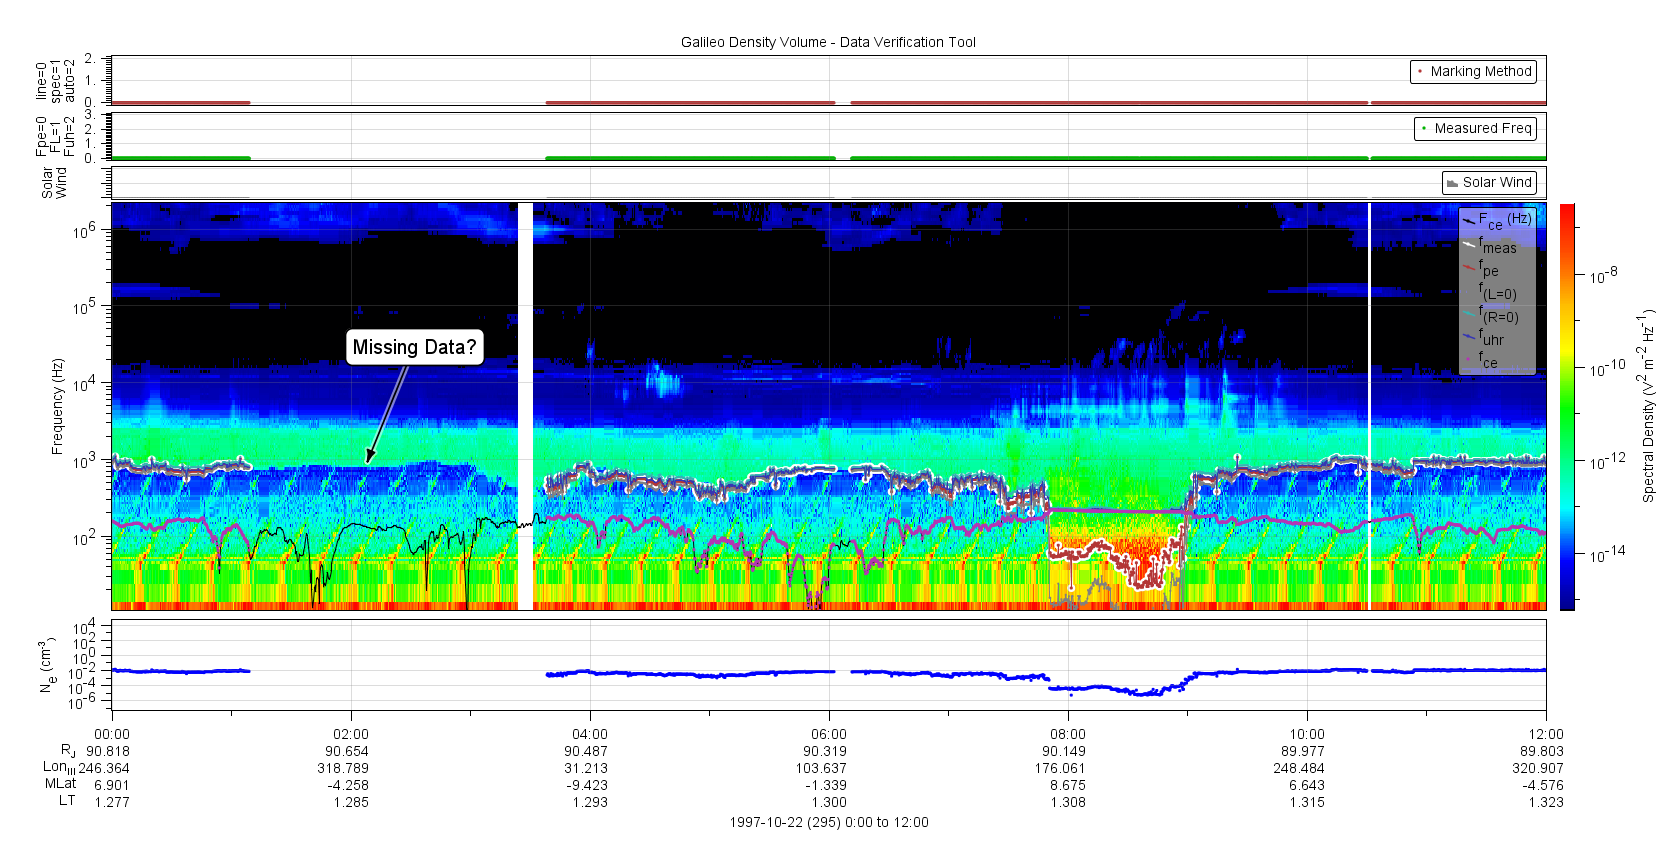
| 1997-295_a | Missing partial day densities? | 1997-295 0:00 to 4:00 | Plot |
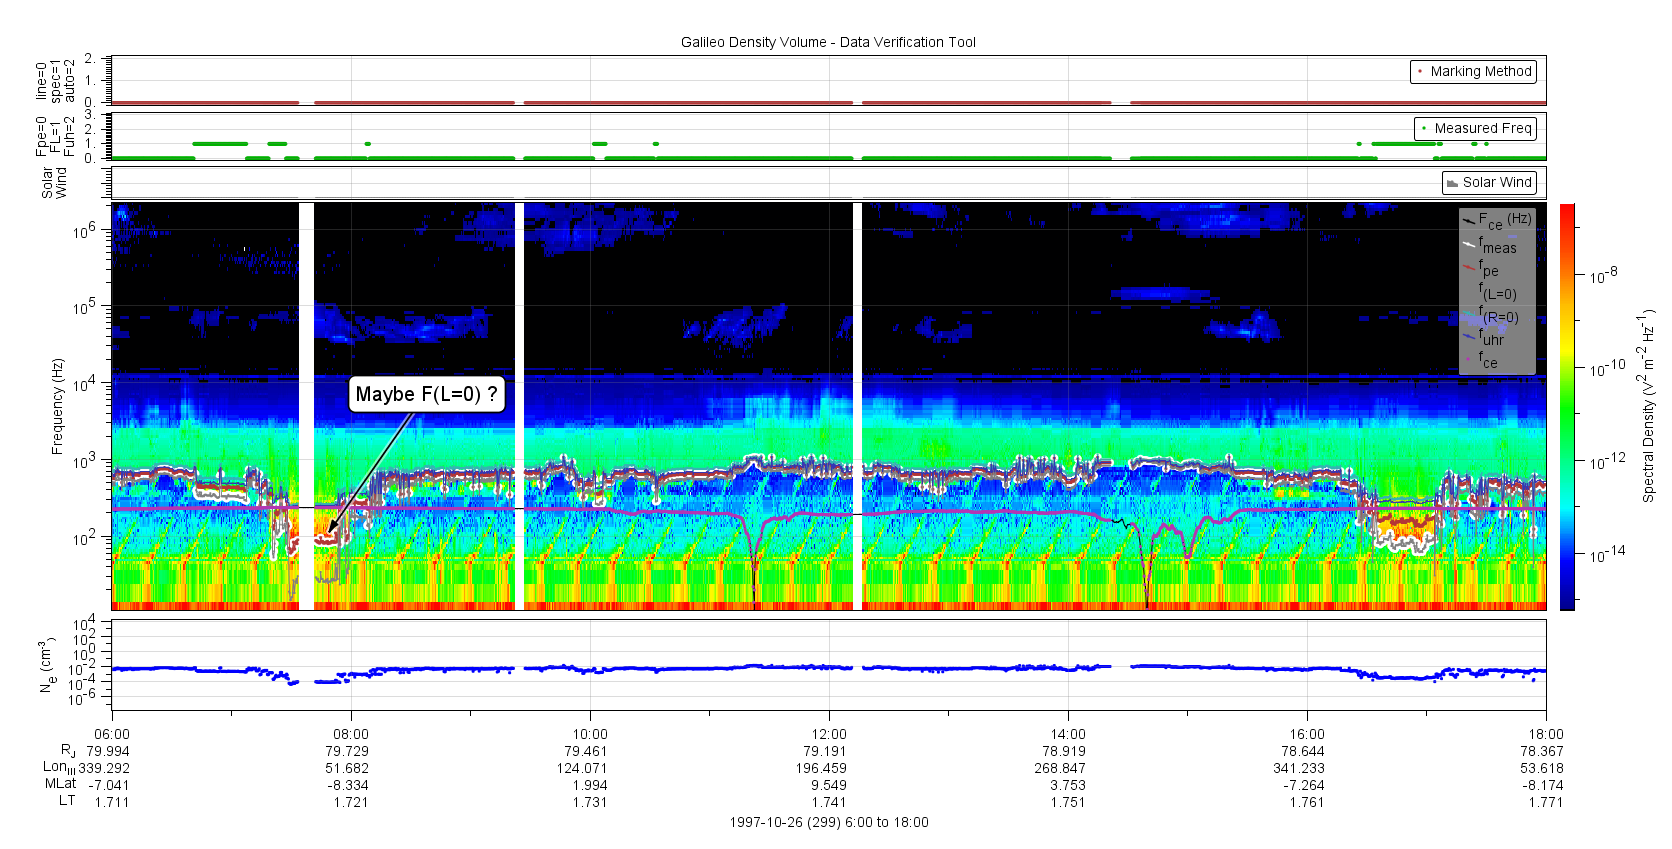
| 1997-299_a | Fpe and F(L=0) usage seems inconsistent | 1997-299 6:00 to 18:00 | Plot |
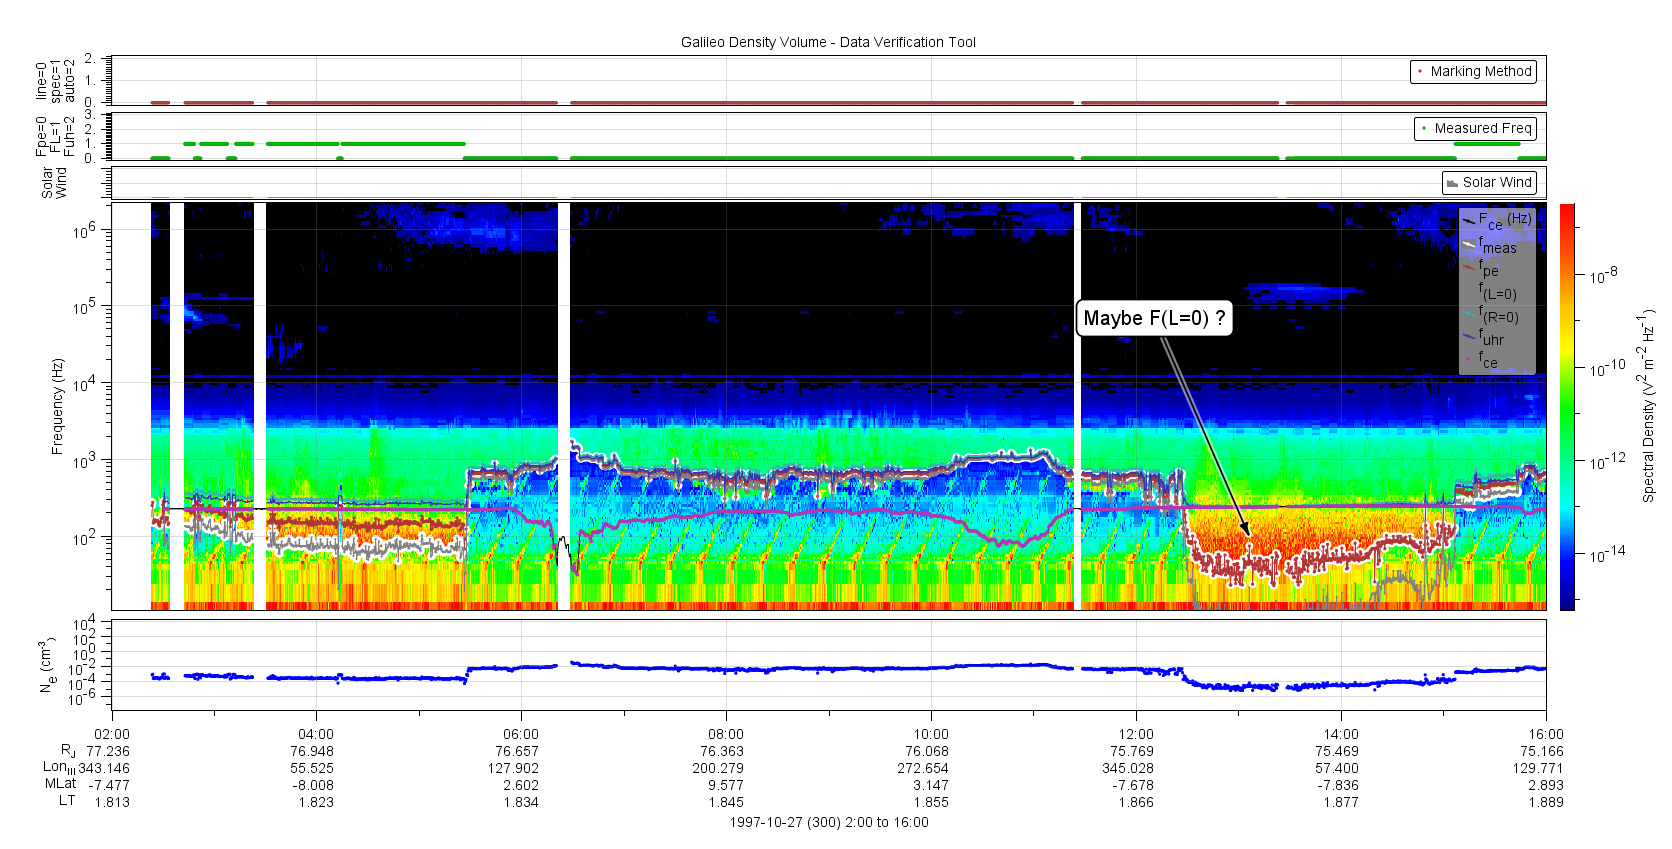
| 1997-300_a | Fpe and F(L=0) usage seems inconsistent | 1997-300 2:00 to 16:00 | Plot |
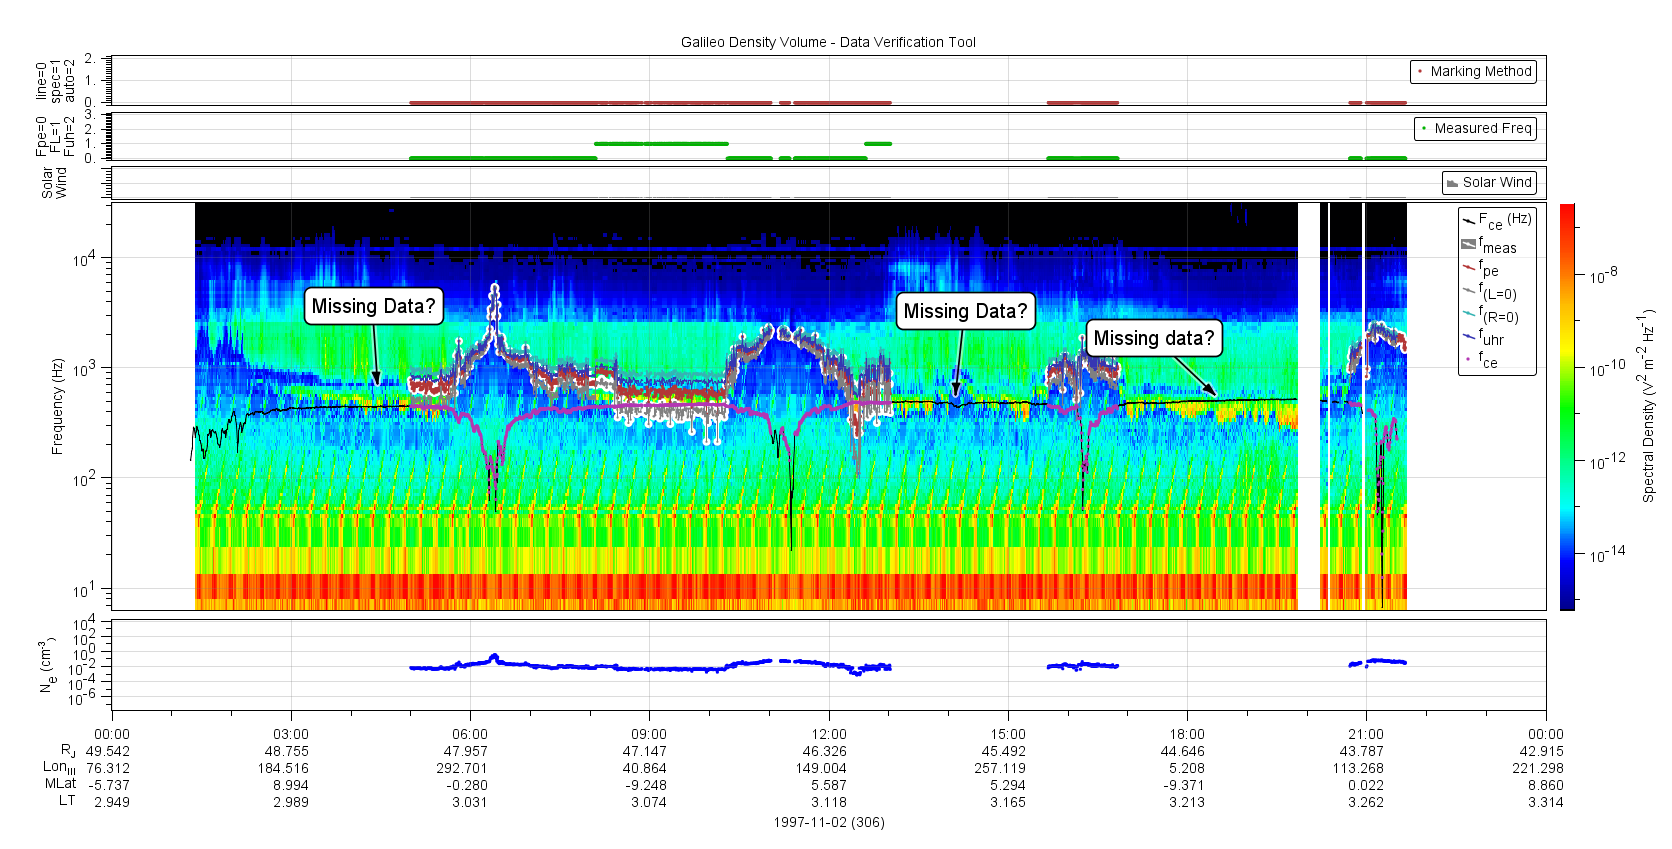
| 1997-306_a | Missing partial day densities? | 1997-306 | Plot |
| 1997-307_a | Can't process input, Duplicate time values with different measurements |
1997-307 | |
| 1997-308_a | Can't process input, Duplicate time values with different measurements |
1997-308 | |
| 1997-311_a | Spectrum without densities | 1997-311 | |
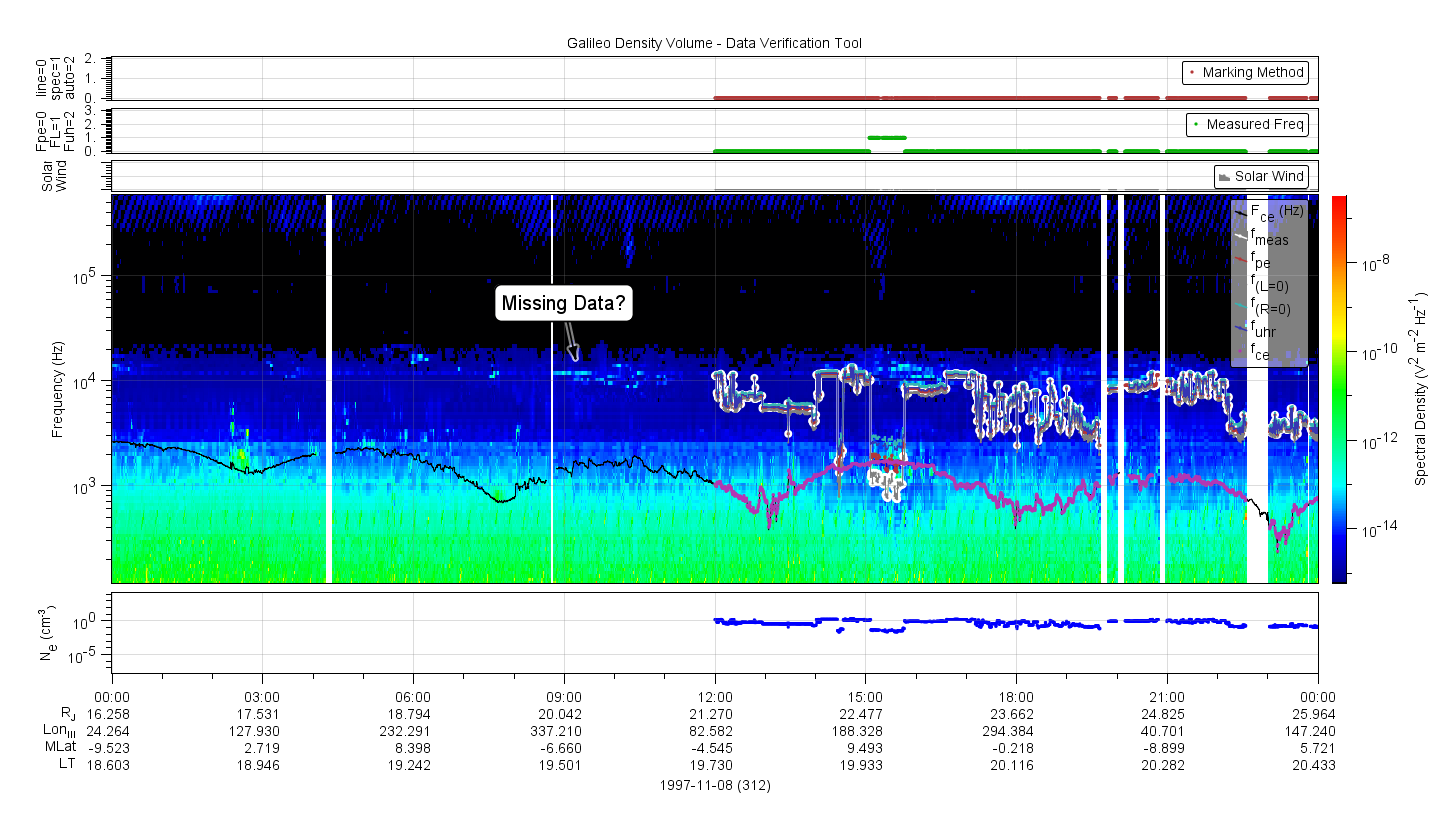
| 1997-312_a | Missing partial day densities? | 1997-312 | Plot |
| 1998-087_a | Spectrum without densities | 1996-087 | |
| 1998-089_a | Spectrum without densities | 1996-089 | |
| 1998-201_a | Spectrum without densities | 1996-201 | |
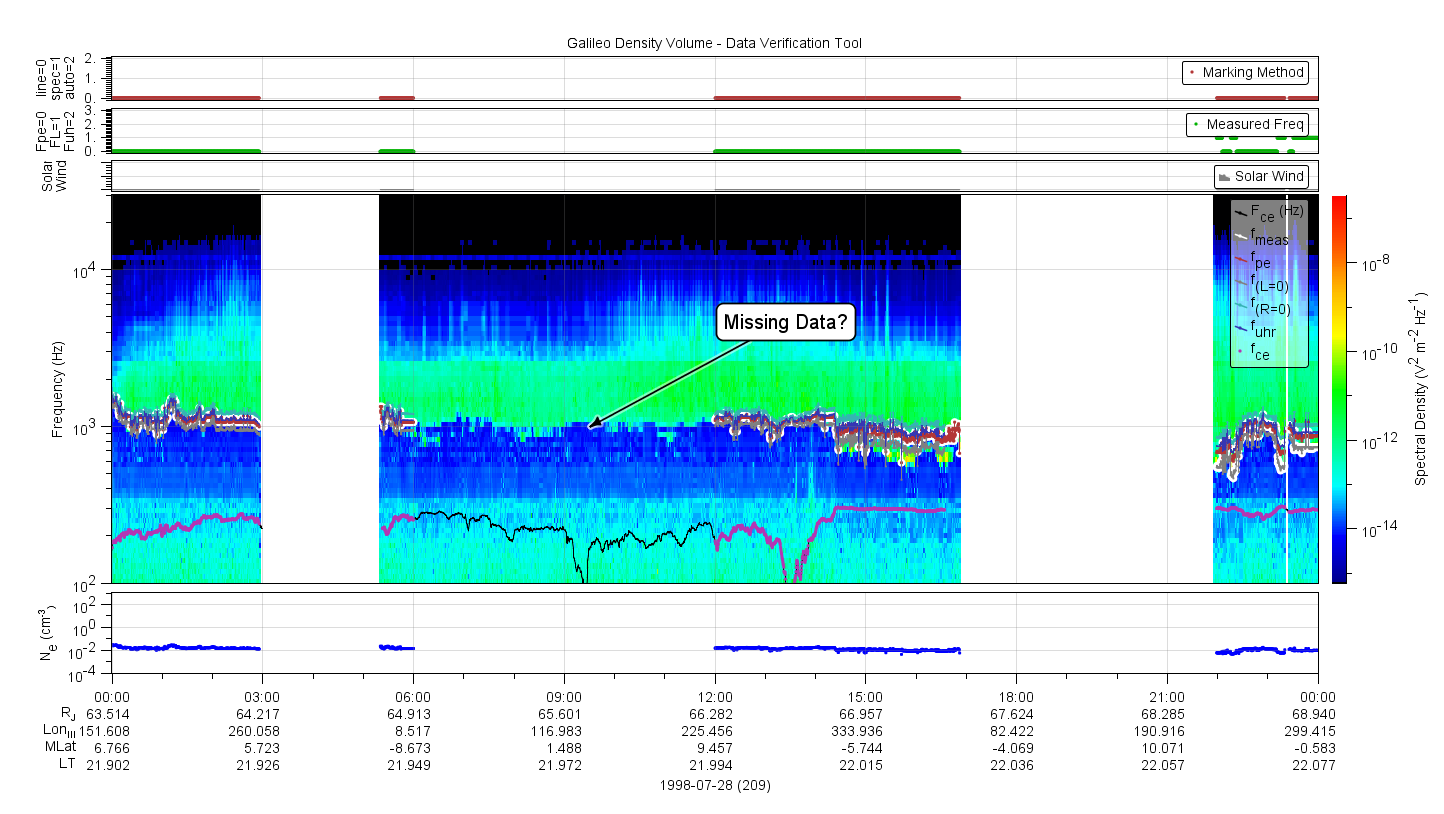
| 1998-209_a | Missing partial day densities? | 1998-209 | Plot |
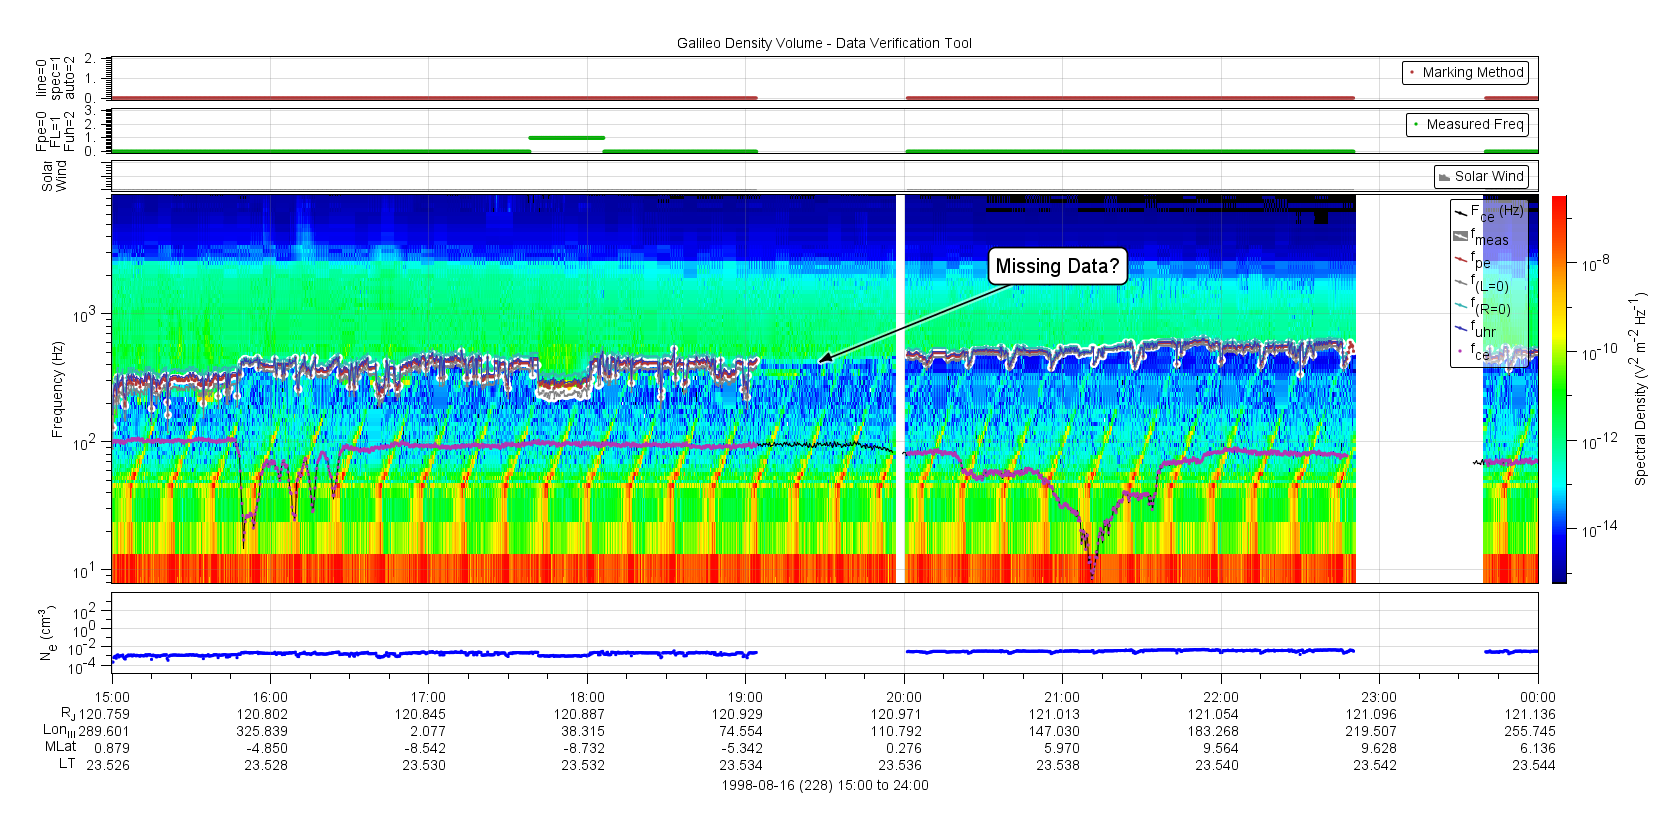
| 1998-228_a | Missing partial day densities? | 1998-228 | Plot |
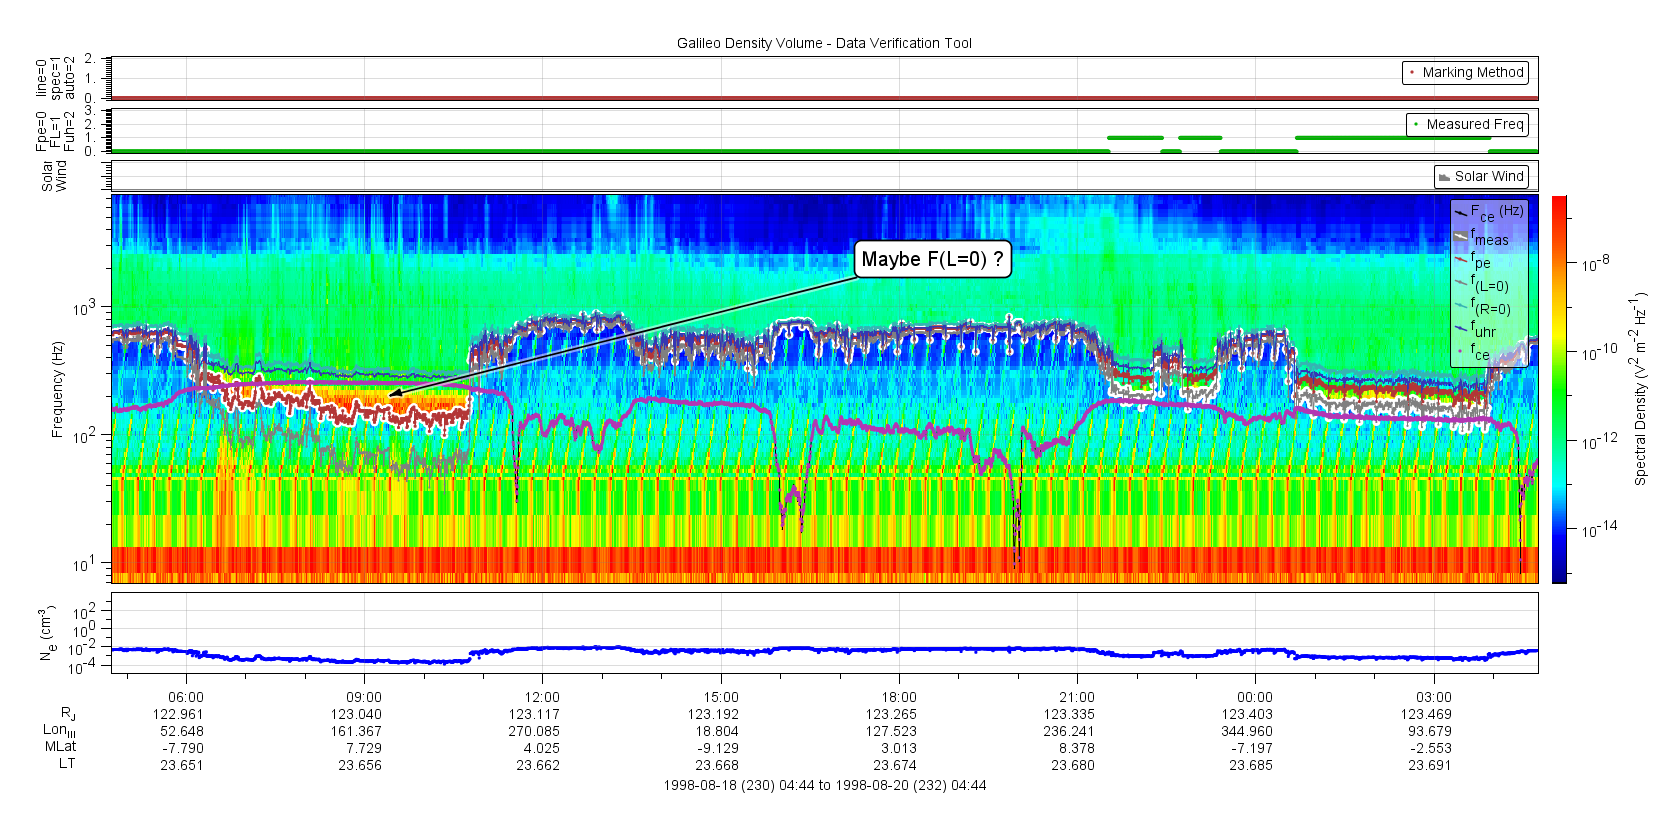
| 1998-231_a | Fpe and F(L=0) usage seems inconsistent | 1998-231T05:00 to 1998-232T04:00 | Plot |
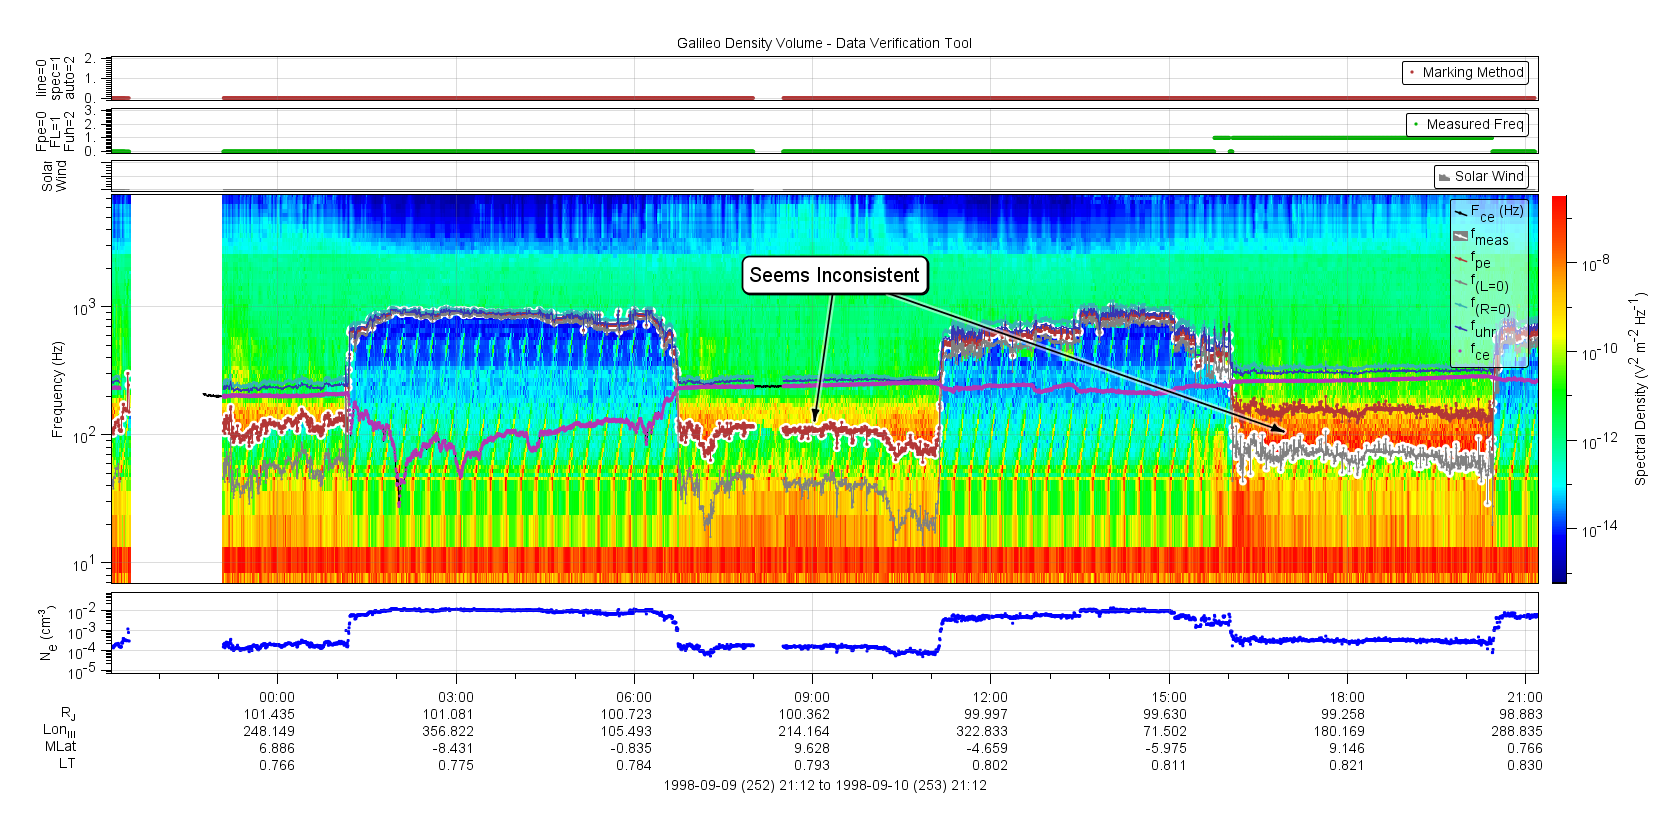
| 1998-252_a | Fpe vs F(L=0) usage seems inconsistent | 1998-252 0:00 to 21:00 | Plot |
| 1998-268_a | Spectrum without densities | 1996-268 | |
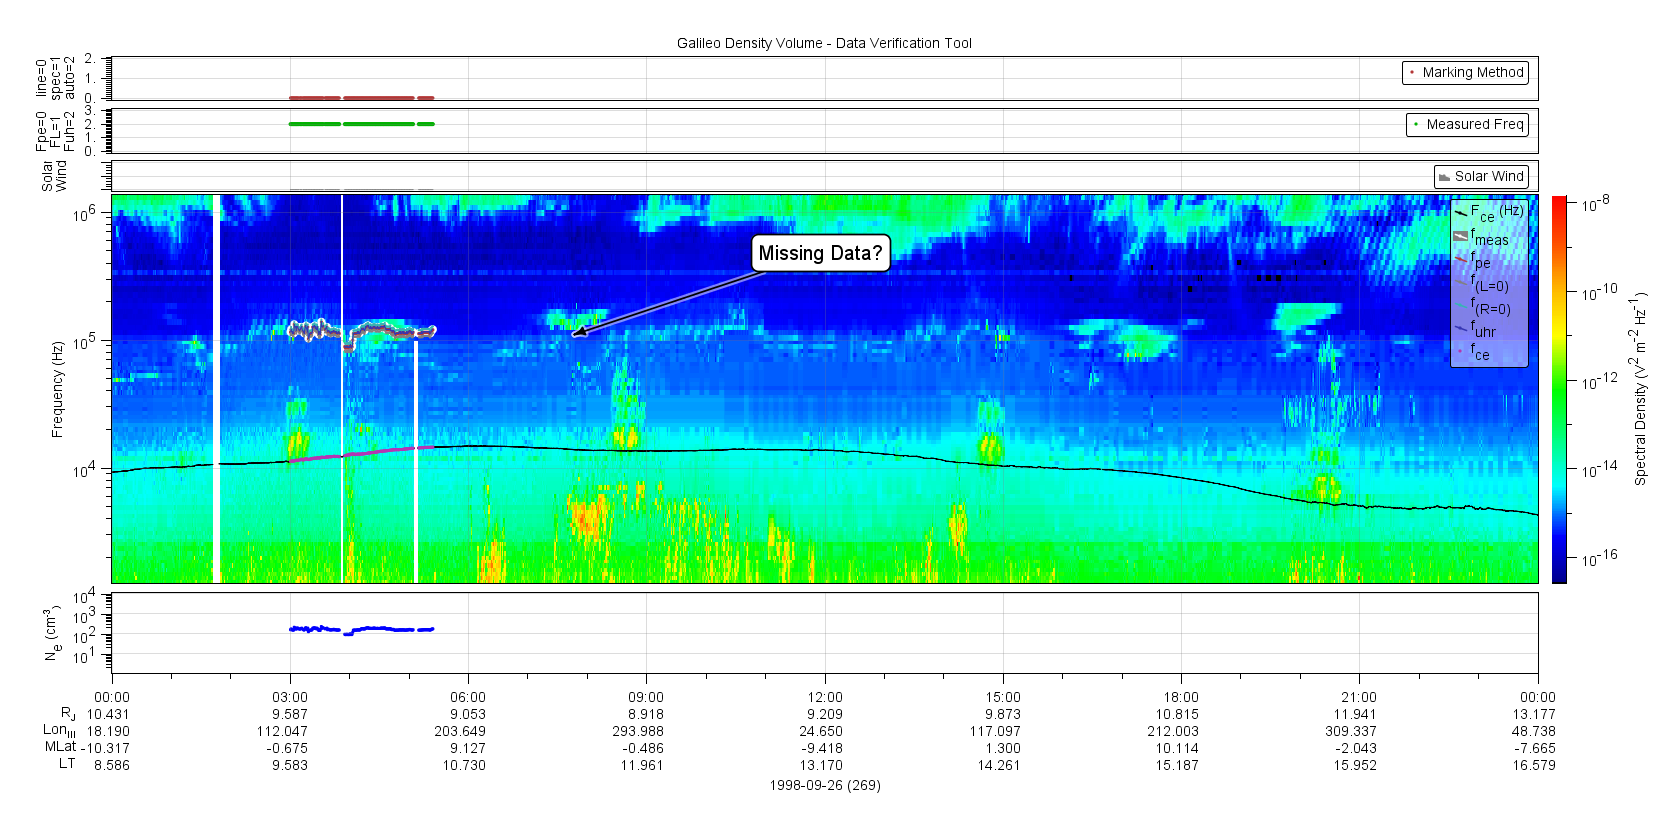
| 1998-269_a | Missing partial day densities? | 1998-269 | Plot |
| 1998-327_a | Spectrum without densities | 1998-327 | |
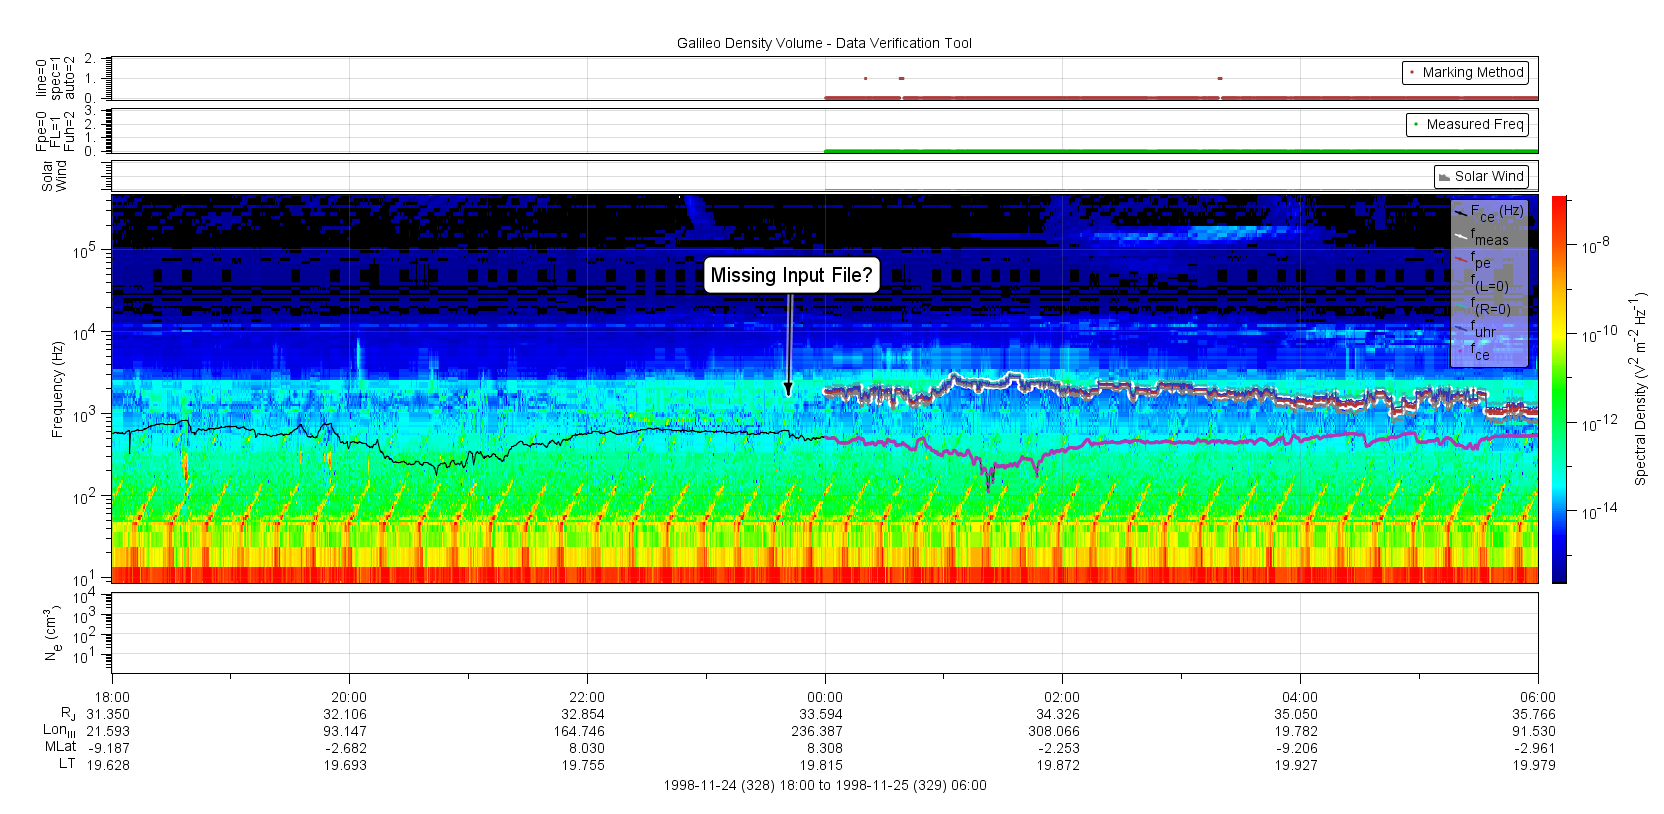
| 1998-328_a | Spectrum without densities | 1998-328 | Plot |
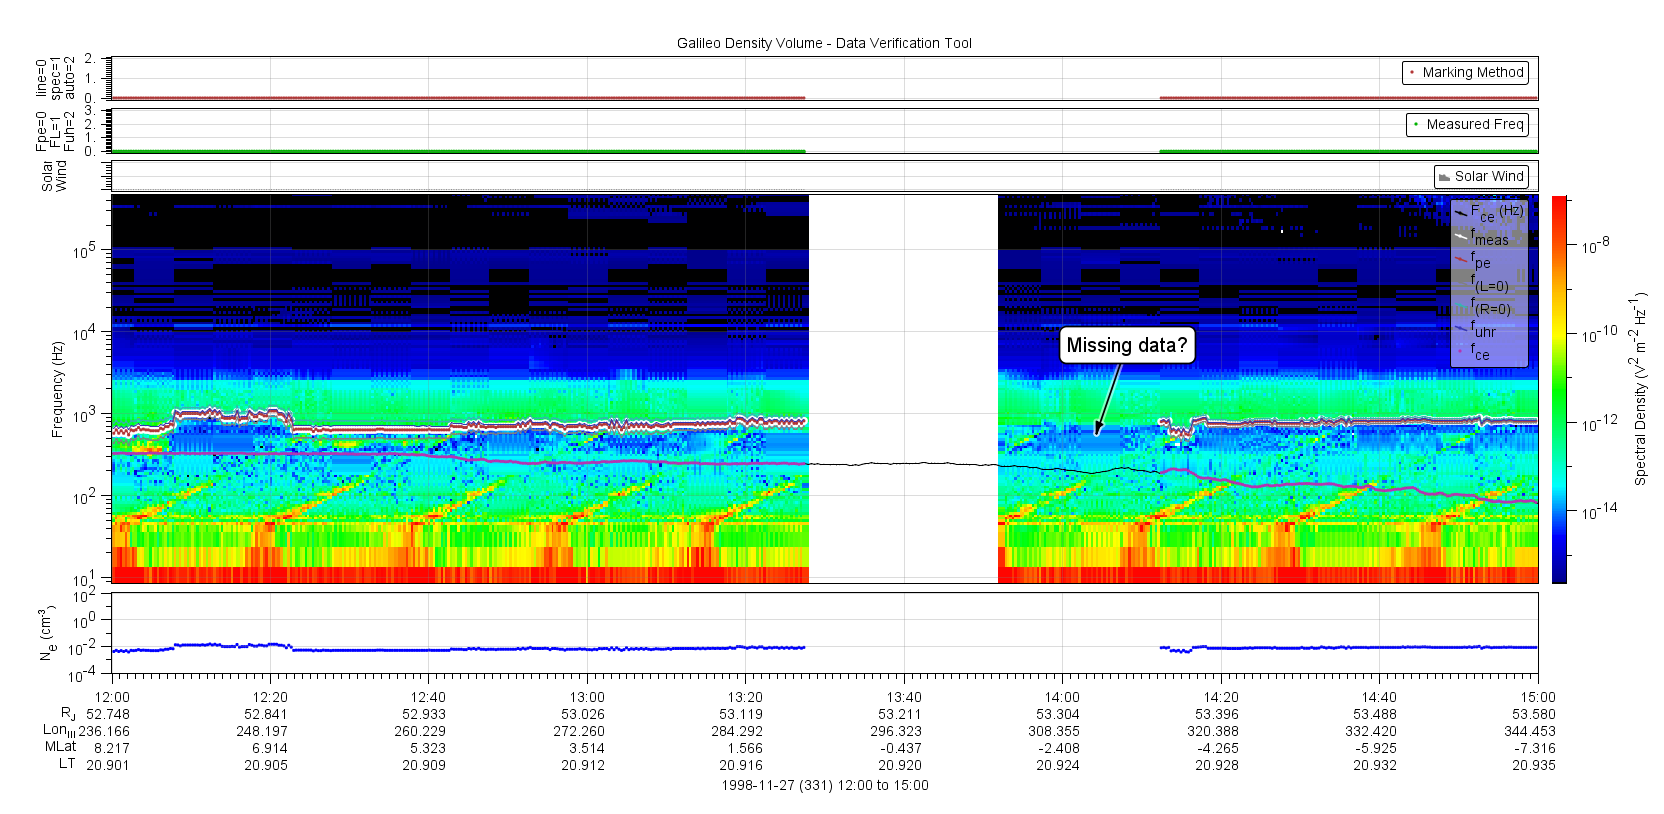
| 1998-331_b | Missing partial day densities? | 1998-331 12:00 to 15:00 | Plot |
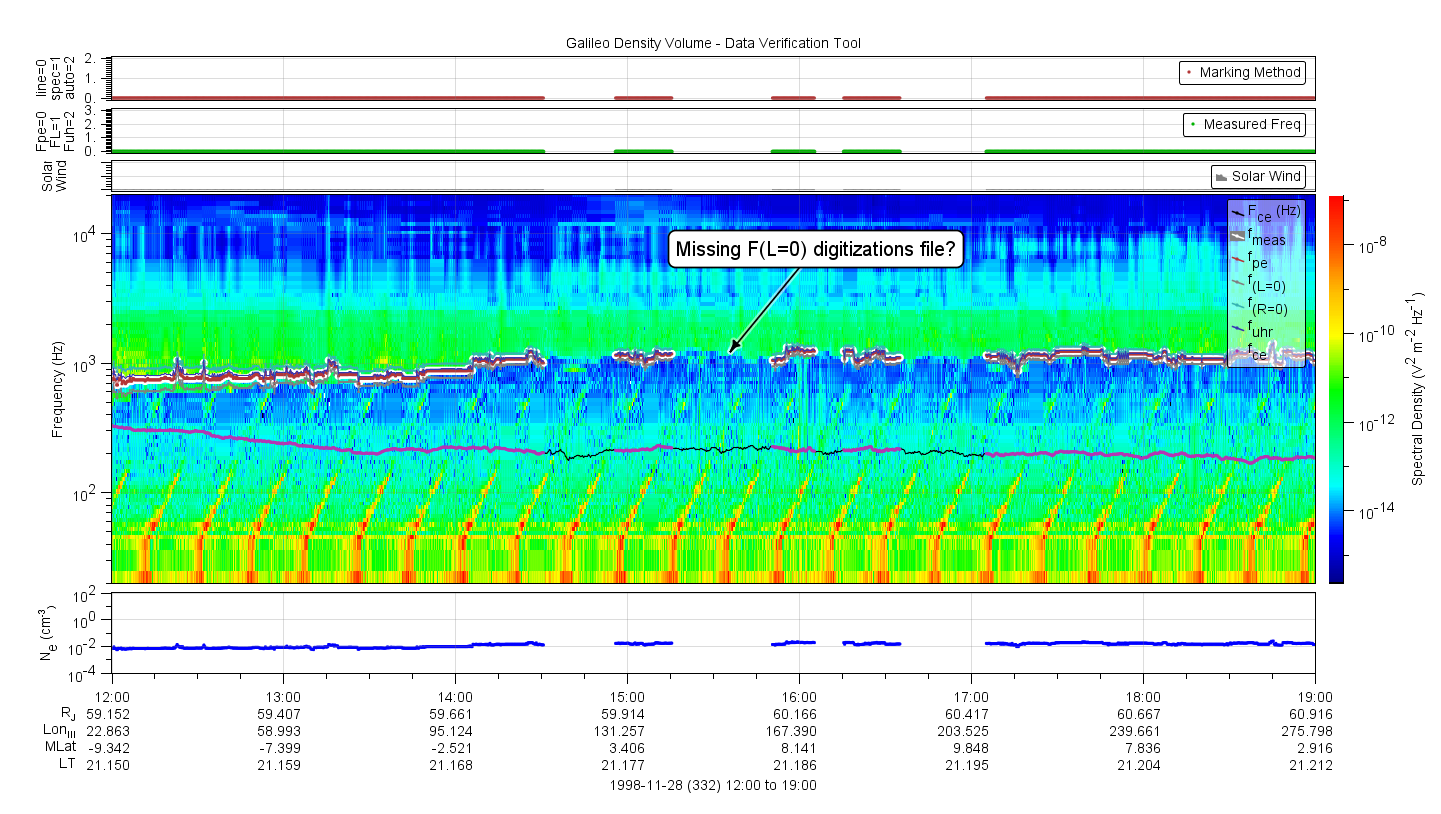
| 1998-332_a | Missing partial day densities? | 1998-332 12:00 to 19:00 | Plot |
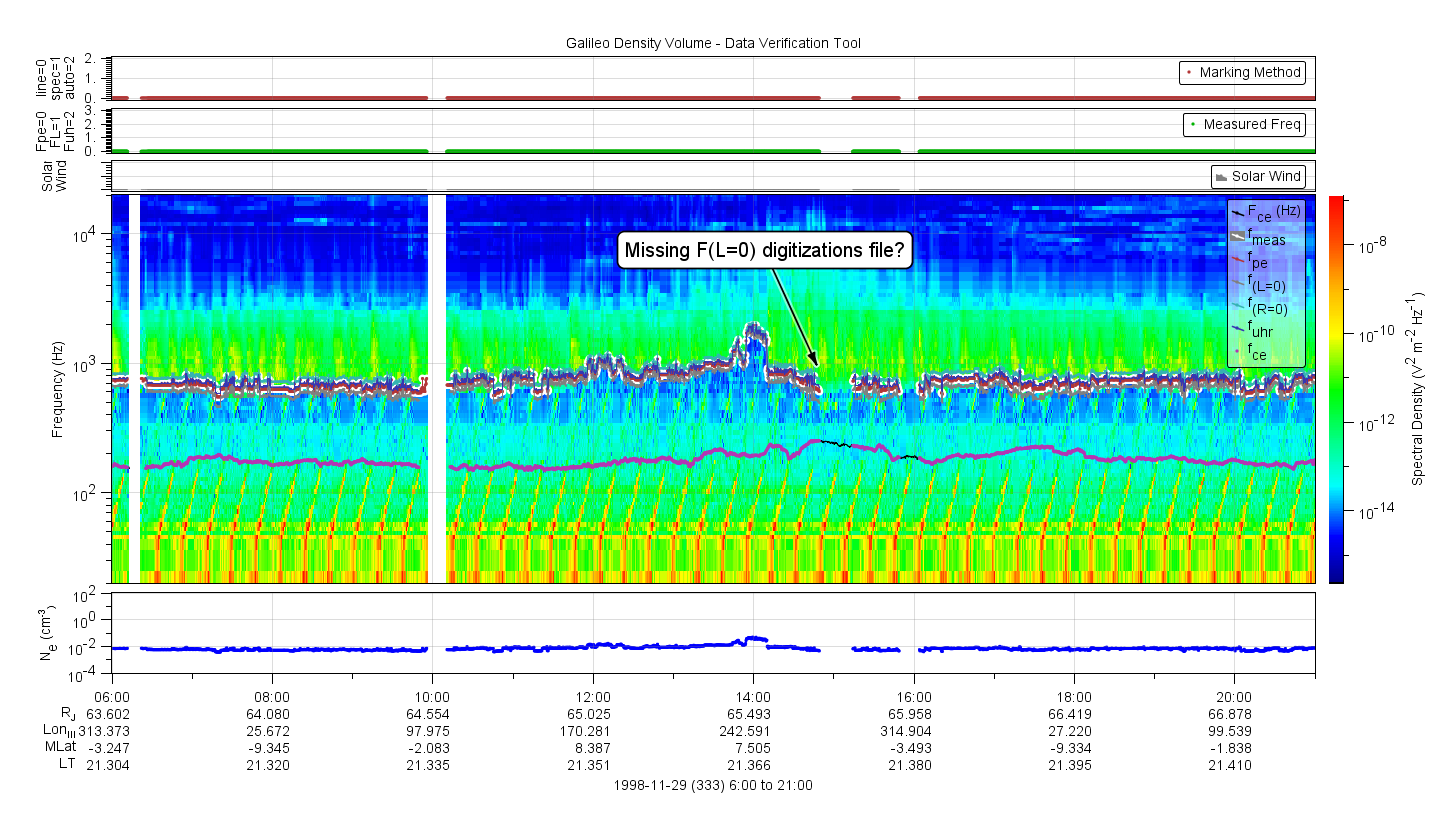
| 1998-333_a | Missing partial day densities? | 1998-333 12:00 to 17:00 | Plot |
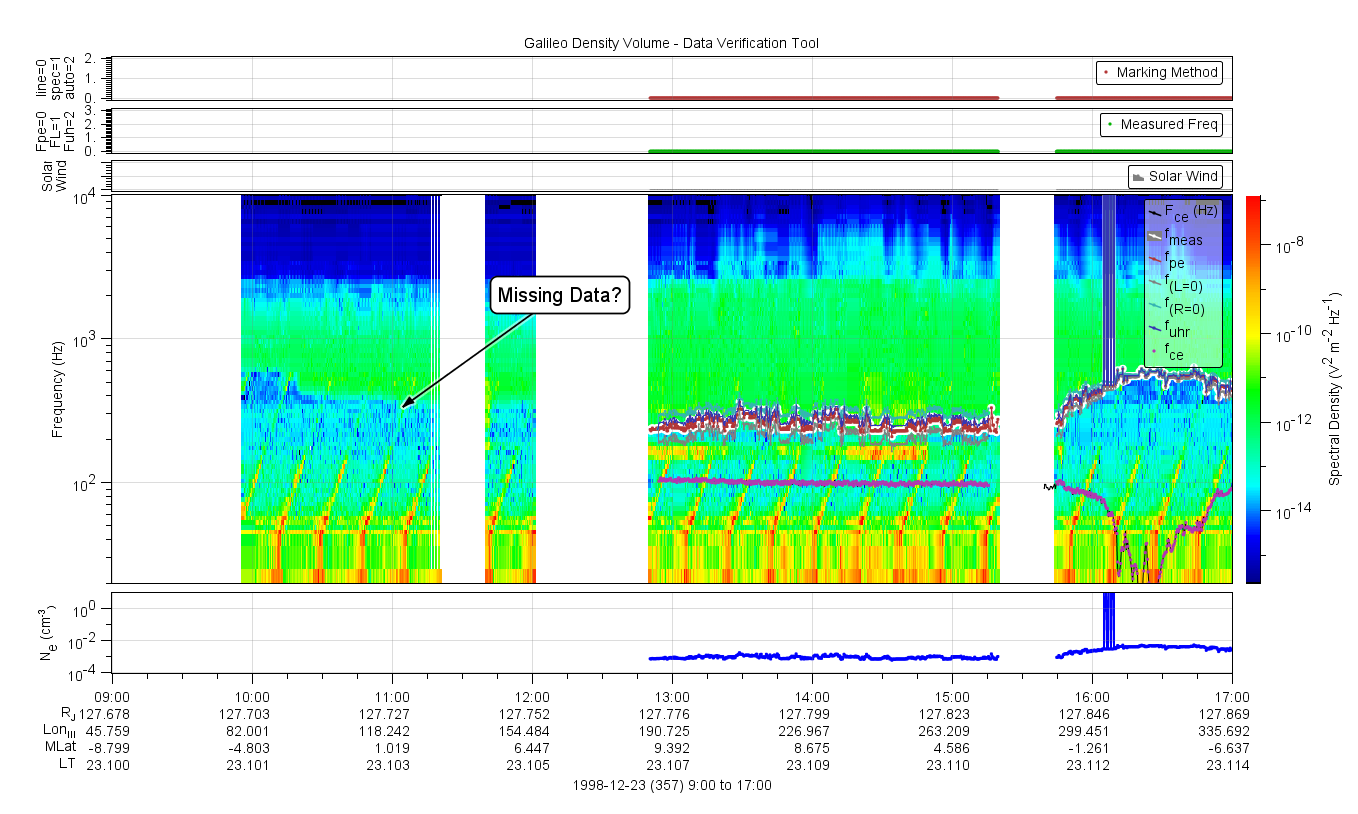
| 1998-357_b | Missing partial day densities? | 1998-357 9:00 to 17:00 | Plot |
| 1999-122_a | Spectrum without densities for entire day | 1999-122 | |
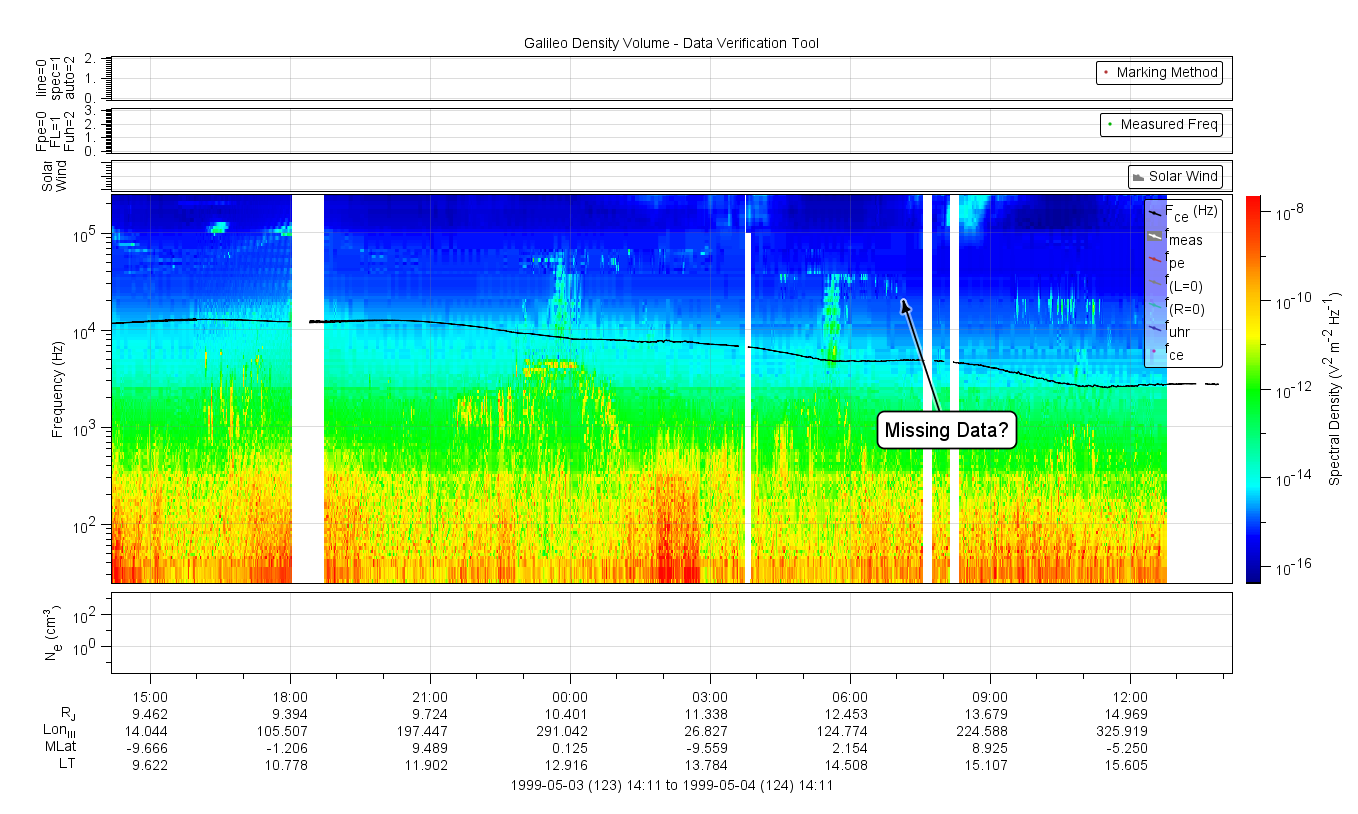
| 1999-123_a | Spectrum without densities for entire day | 1999-123 | |
| 1999-124_a | Missing partial day densities? | 1999-124 4:00 to 12:00 | Plot |
| 1999-127_a | Input has quality flag value 'tweak' | 1999-127 | |
| 1999-128_a | Input has quality flag value 'tweak' | 1999-128 | |
| 1999-130_a | Input has quality flag value 'tweak' | 1999-130 | |
| 1999-131_a | Input has quality flag value 'tweak' | 1999-131 | |
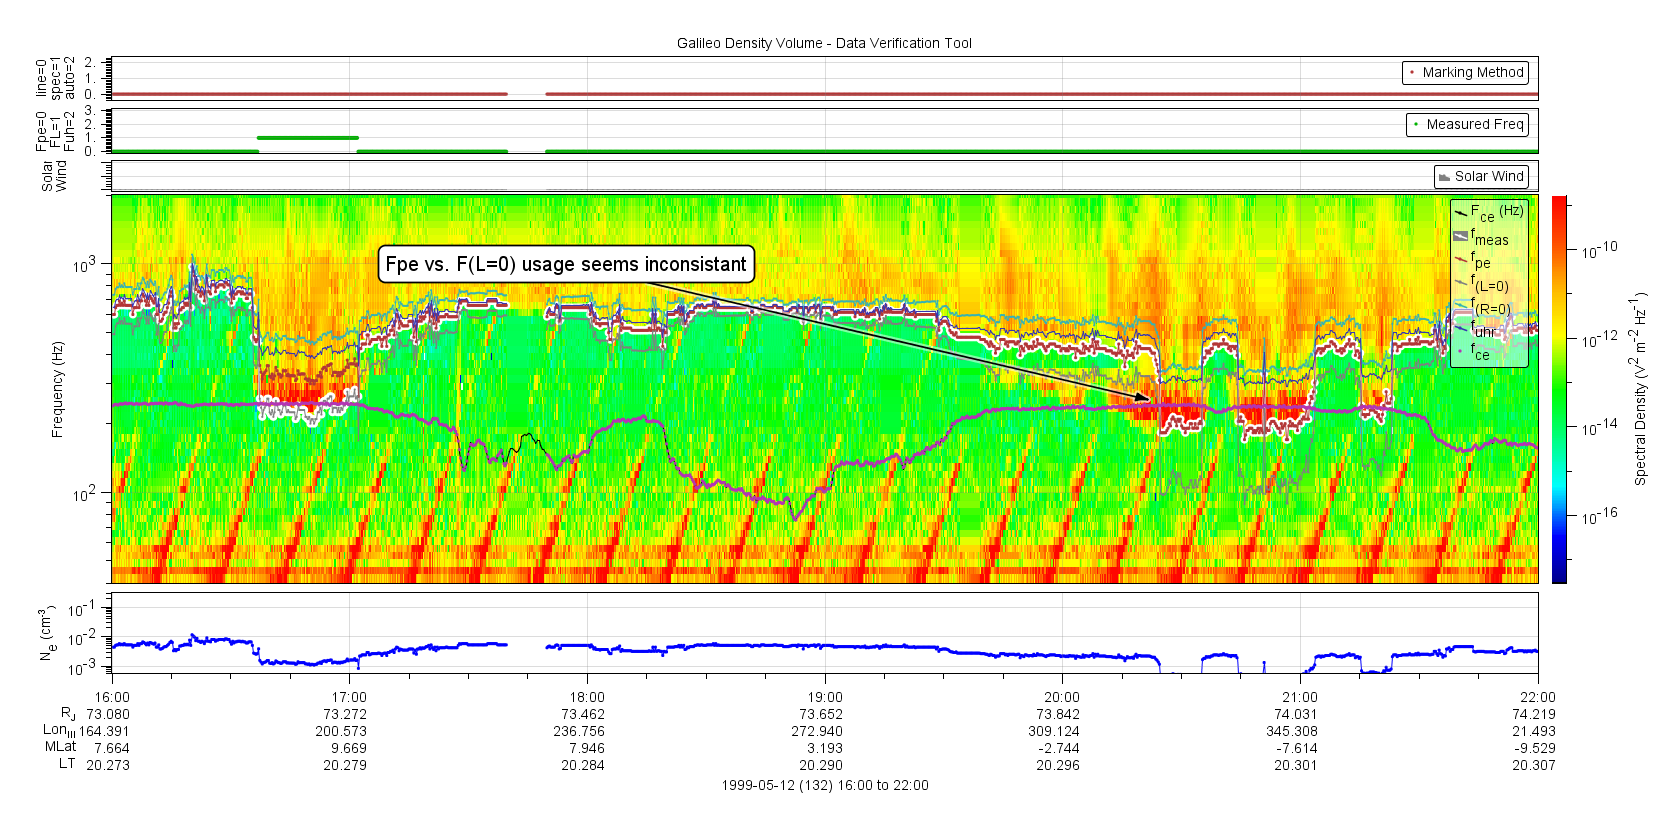
| 1999-132_a | Fpe vs F(L=0) usage seems inconsistent | 1999-132 16:00 to 22:00 | Plot |
| 1999-133_a | Can't process input, Duplicate time values with different measurements |
1999-133 | |
| 1999-134_a |
Data in file pws1999134_ext.data are actually for day 1999-135 but have different values than the actual day 1999-135 file. |
1999-134 | |
| 1999-135_a | Input has quality flag value 'tweak' | 1999-135 | |
| 1999-180_a | Spectrum without densities | 1999-180 | |
| 1999-181_a | Spectrum without densities | 1999-181 | |
| 1999-184_a | Spectrum without densities | 1999-184 | |
| 1999-223_a | Spectrum without densities | 1999-223 | |
| 1999-259_a | Spectrum without densities | 1999-259 | |
| 1999-260_a | Input has quality flag value 'tweak' | 1999-260 | |
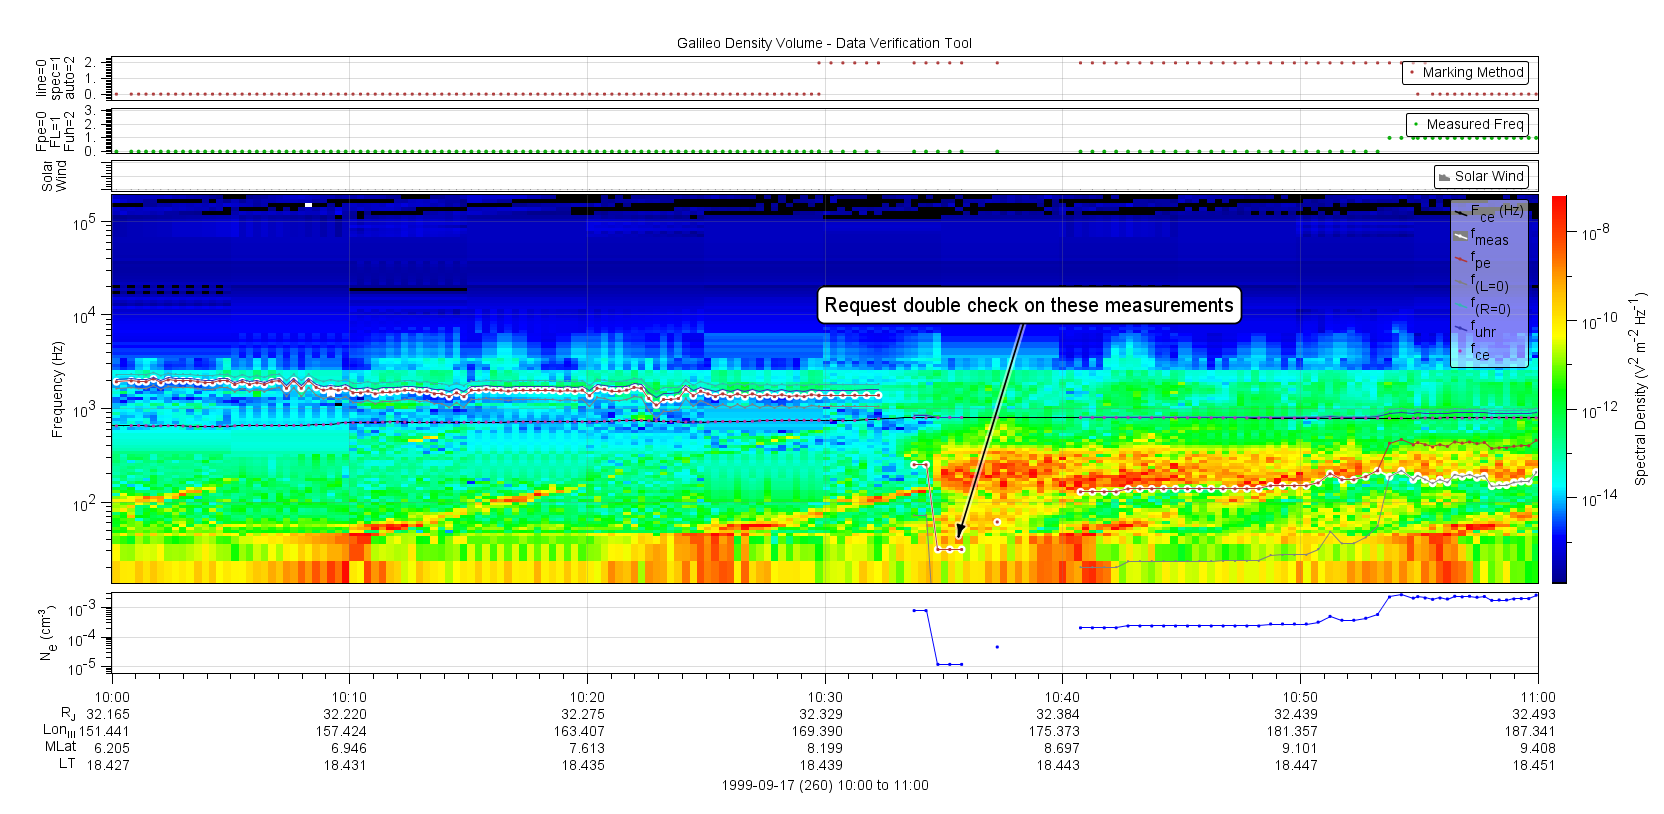
| 1999-260_b | Request a second look at a few points | 1999-260 10:30 to 10:45 | Plot |
| 1999-261_a | Input has quality flag value 'tweak' | 1999-261 | |
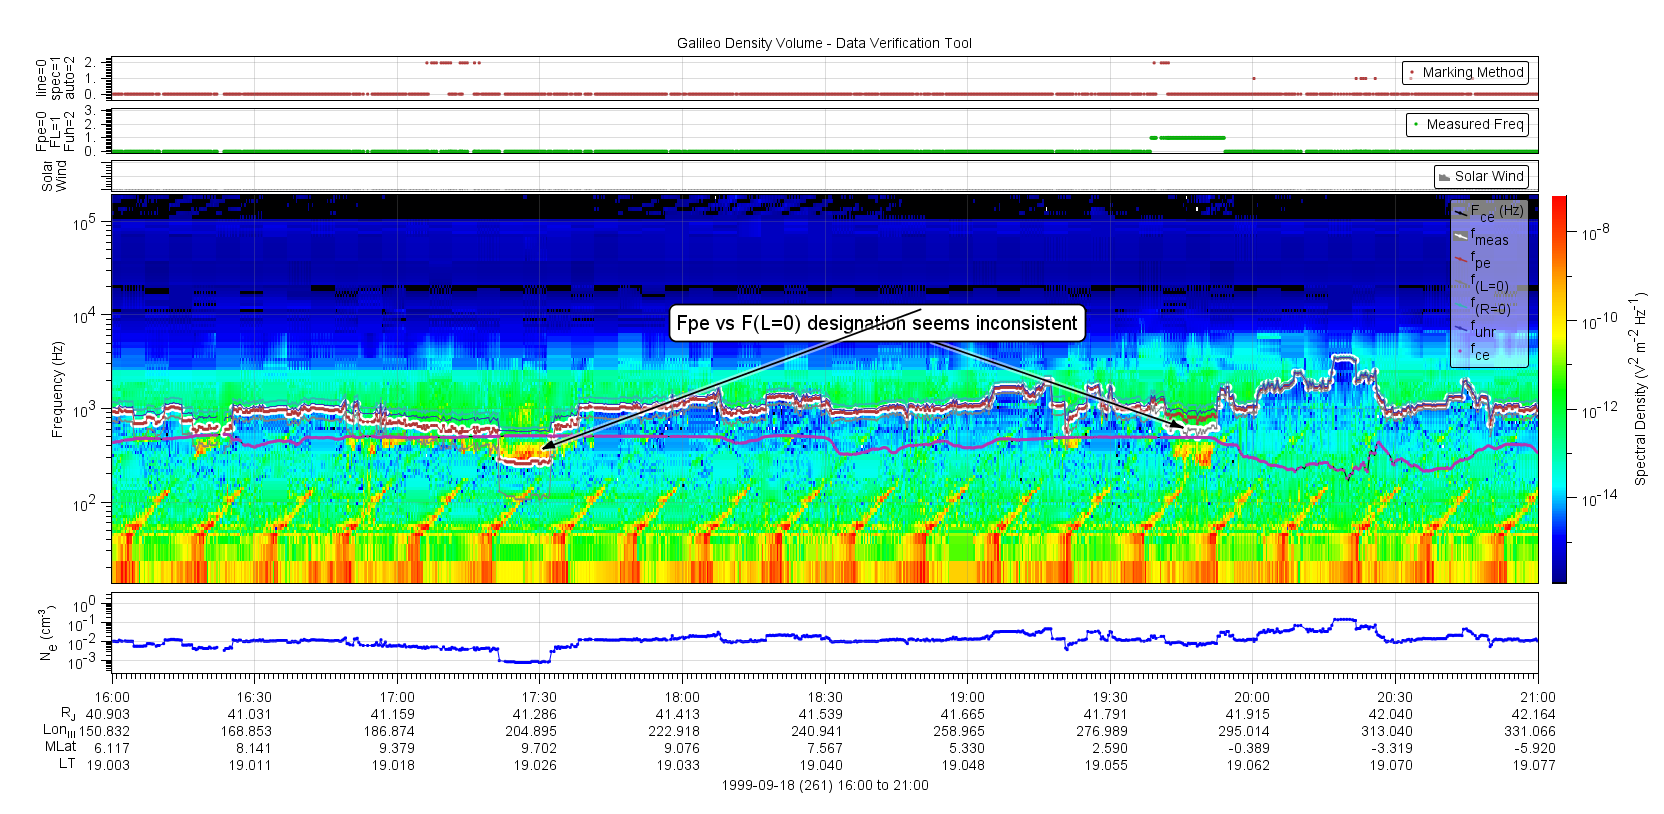
| 1999-261_b | Fpe vs F(L=0) usage seems inconsistent | 1999-261 16:00 to 21:00 | Plot |
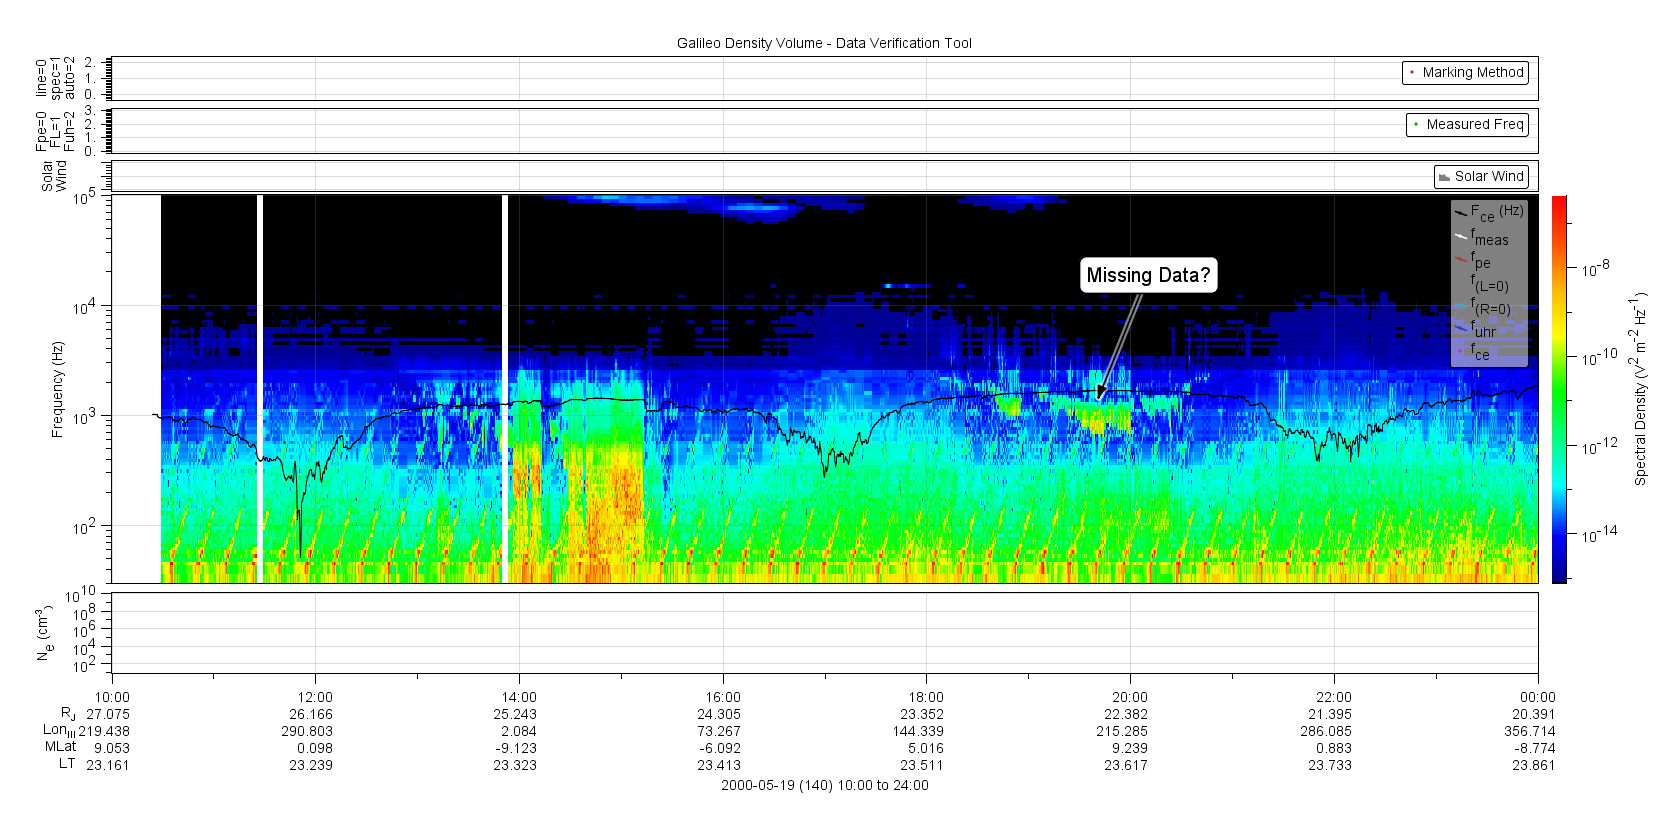
| 2000-140_a | Spectrum without densities | 2000-140 12:00 to 22:00 | Plot |
| 2000-147_a | Input has quality flag value 'tweak' | 2000-147 | |
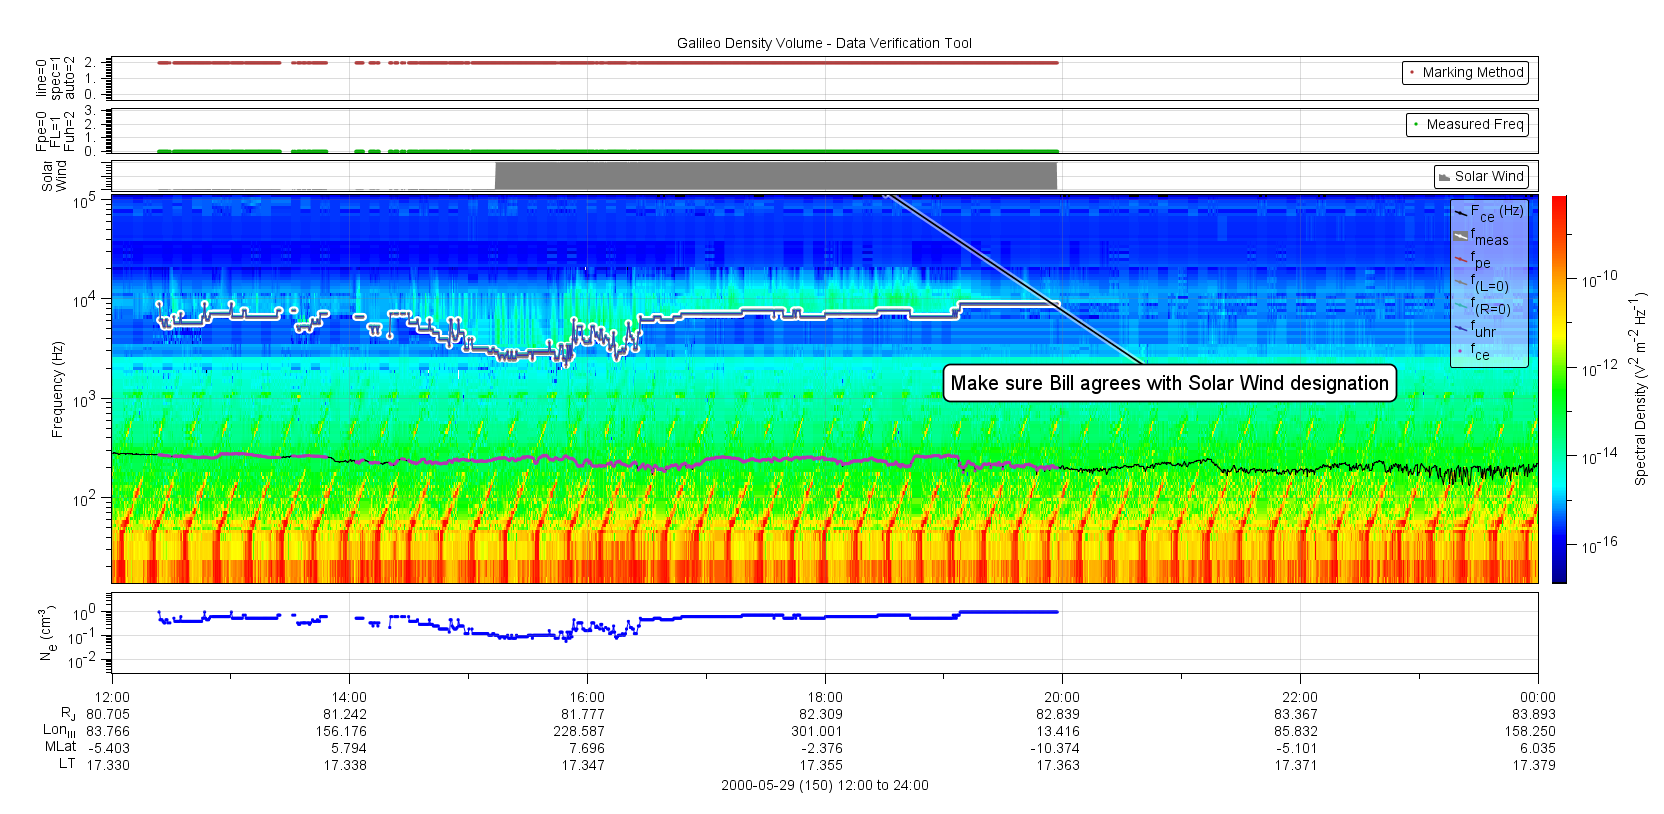
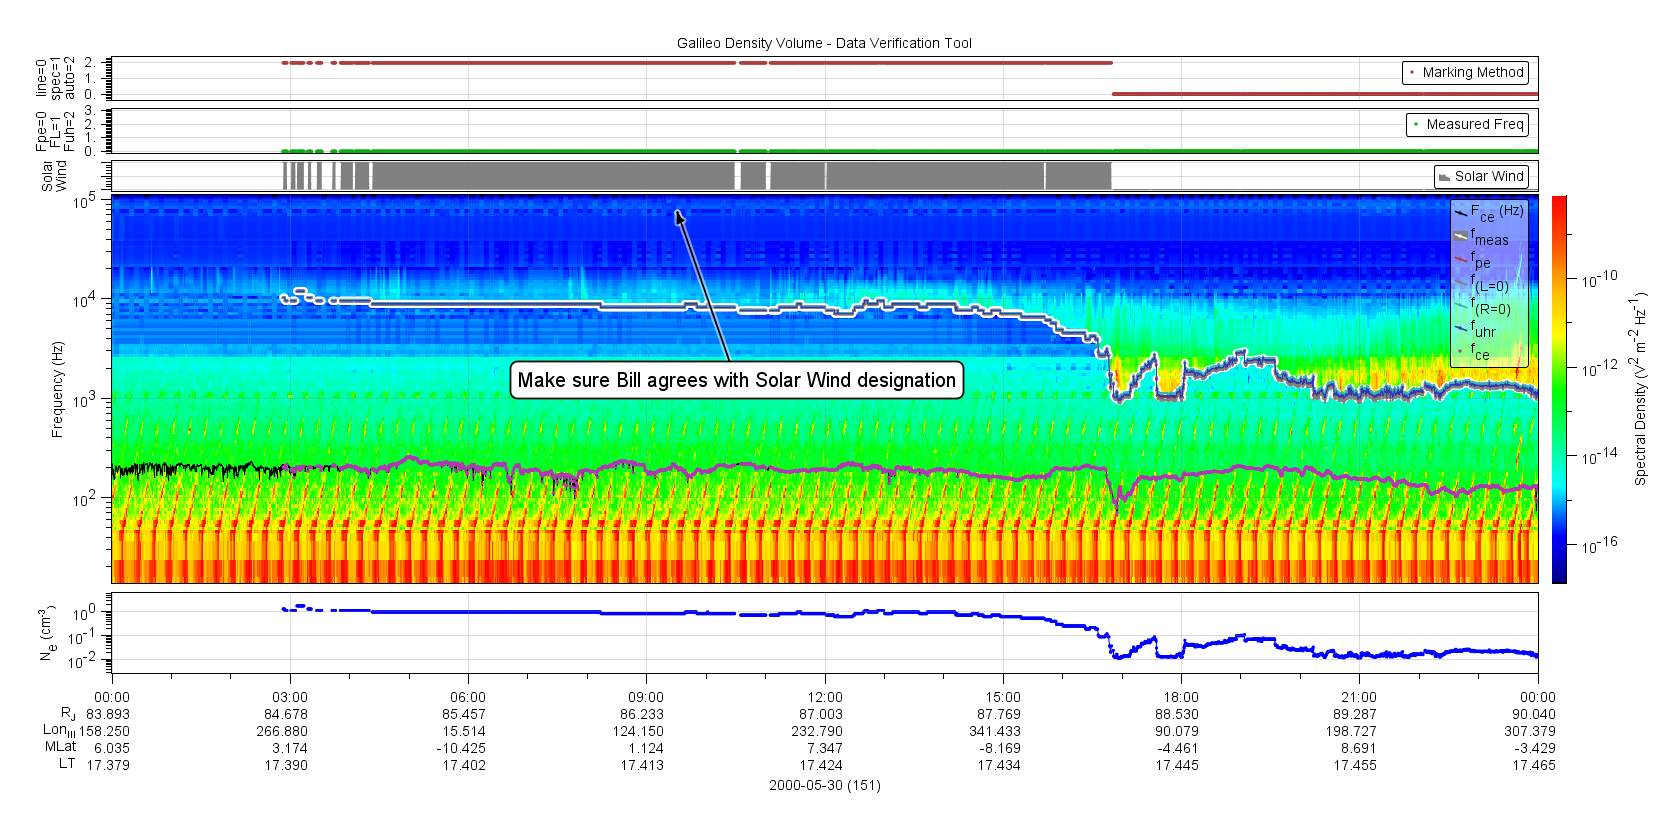
| 2000-150_a | Request double-check of Solar Wind flag | 2000-150 to 2000-152 | Plot1 Plot2 |
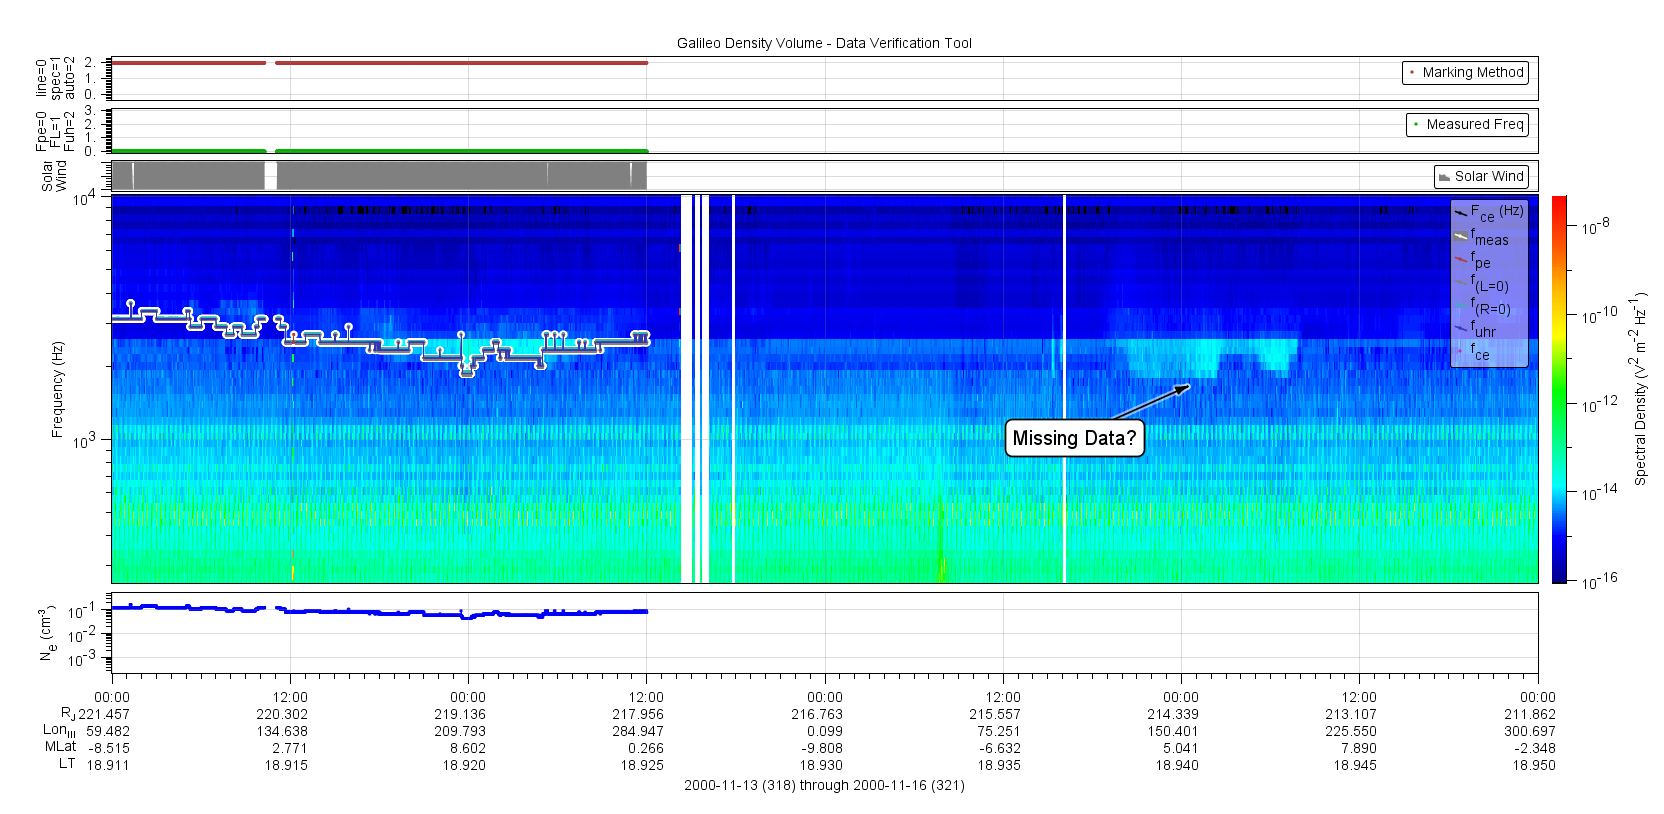
| 2000-320_a | Spectrum without densities | 2000-318 to 2000-321 | Plot1 |
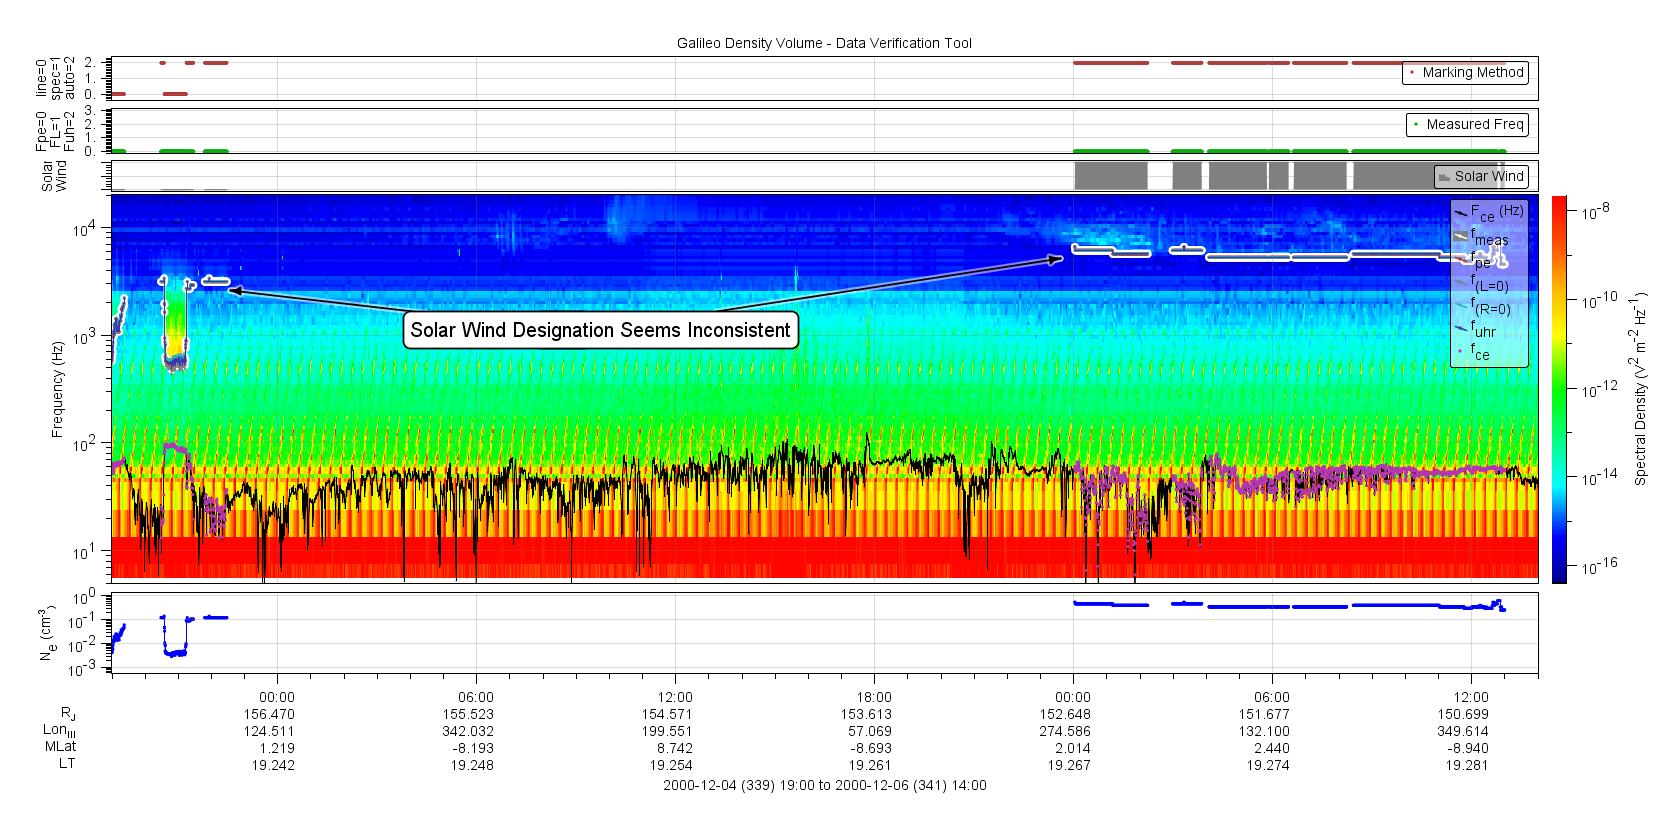
| 2000-339_a | Solar wind designation seems inconsintent | 2000-339T18:00 to 2000-341T13:00 | Plot1 |
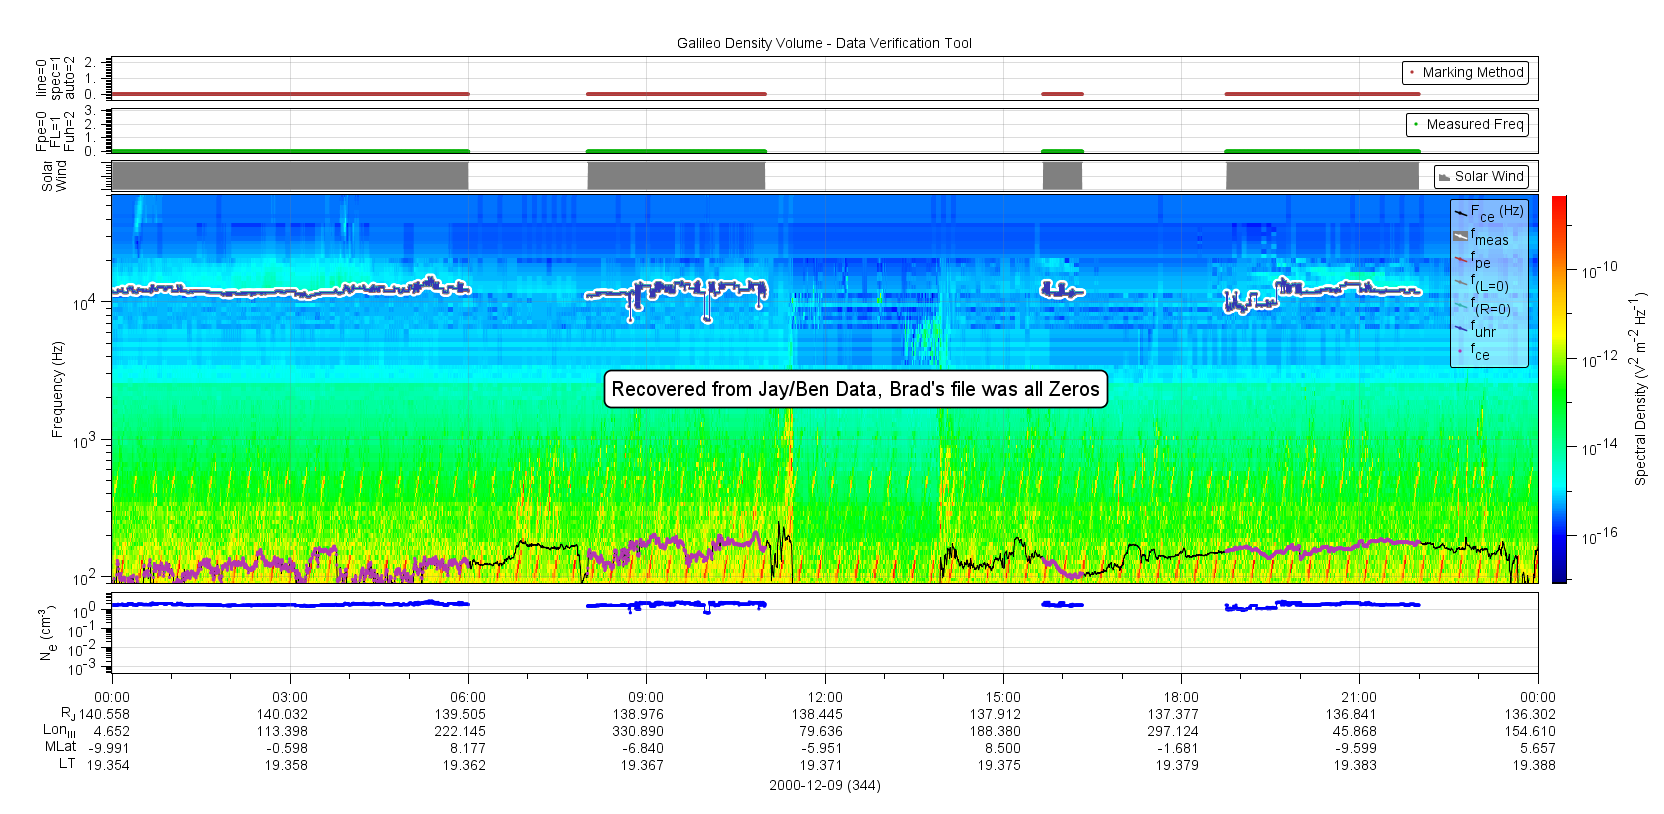
| 2000-344_a | Double check requested, Brad's file was all zeros,
data recovered from Ansher/Richard's files |
2000-343 to 2000-345 | Plot |
| 2000-345_a | Double check requested, data recovered from Ansher/Richard's file. | 2000-344 to 2000-345 | |
| 2000-346_a | Double check requested, data recovered from Ansher/Richard's file. | 2000-345 to 2000-346 | |
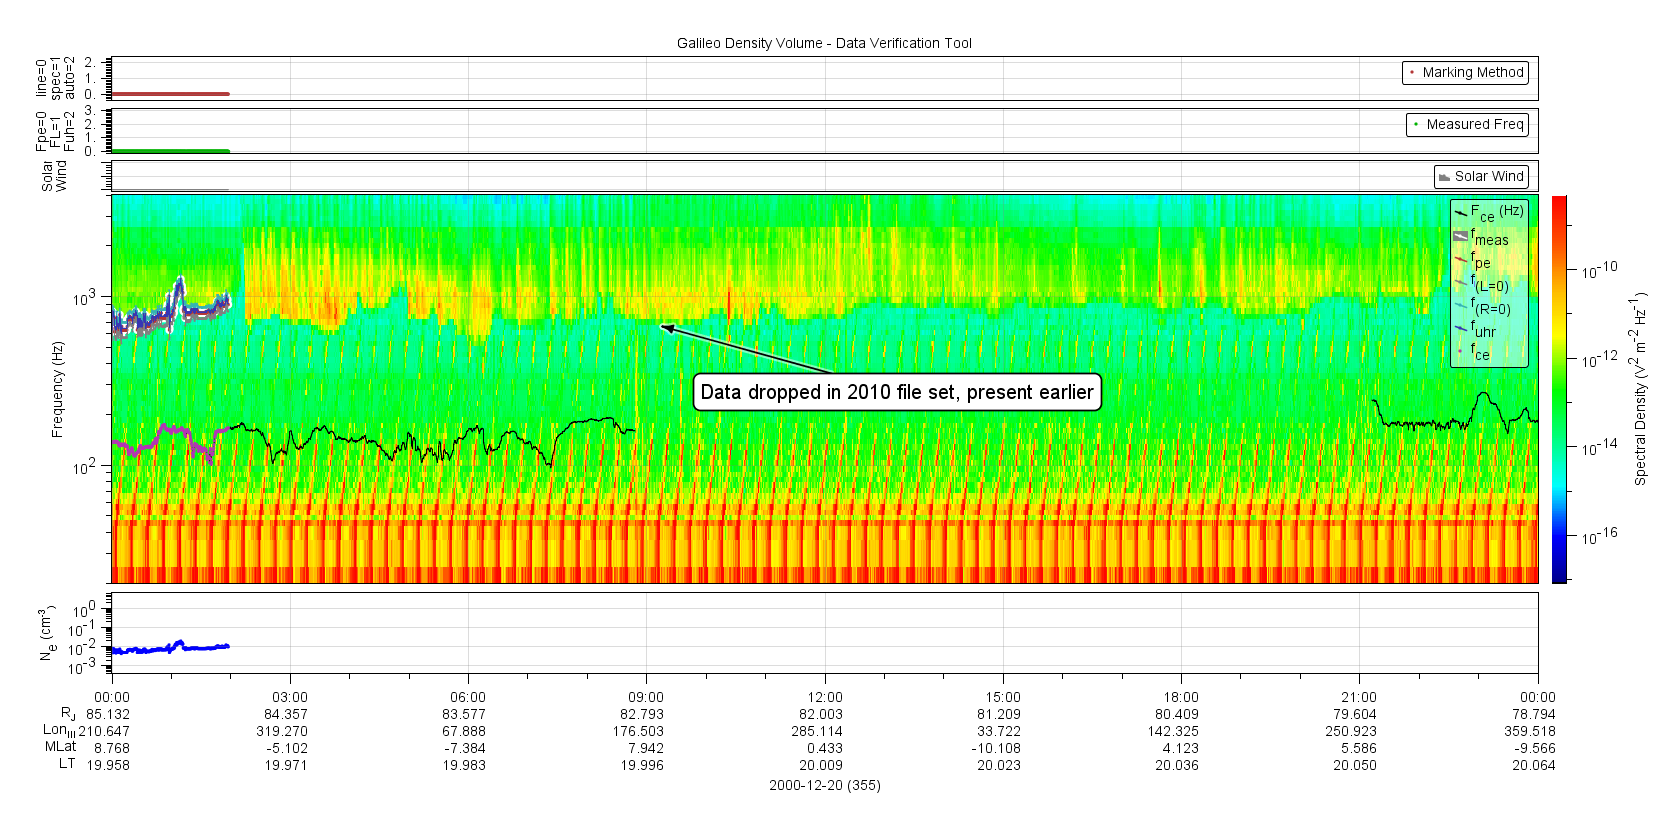
| 2000-355_a | Missing partial day densities | 2000-355 | Plot |
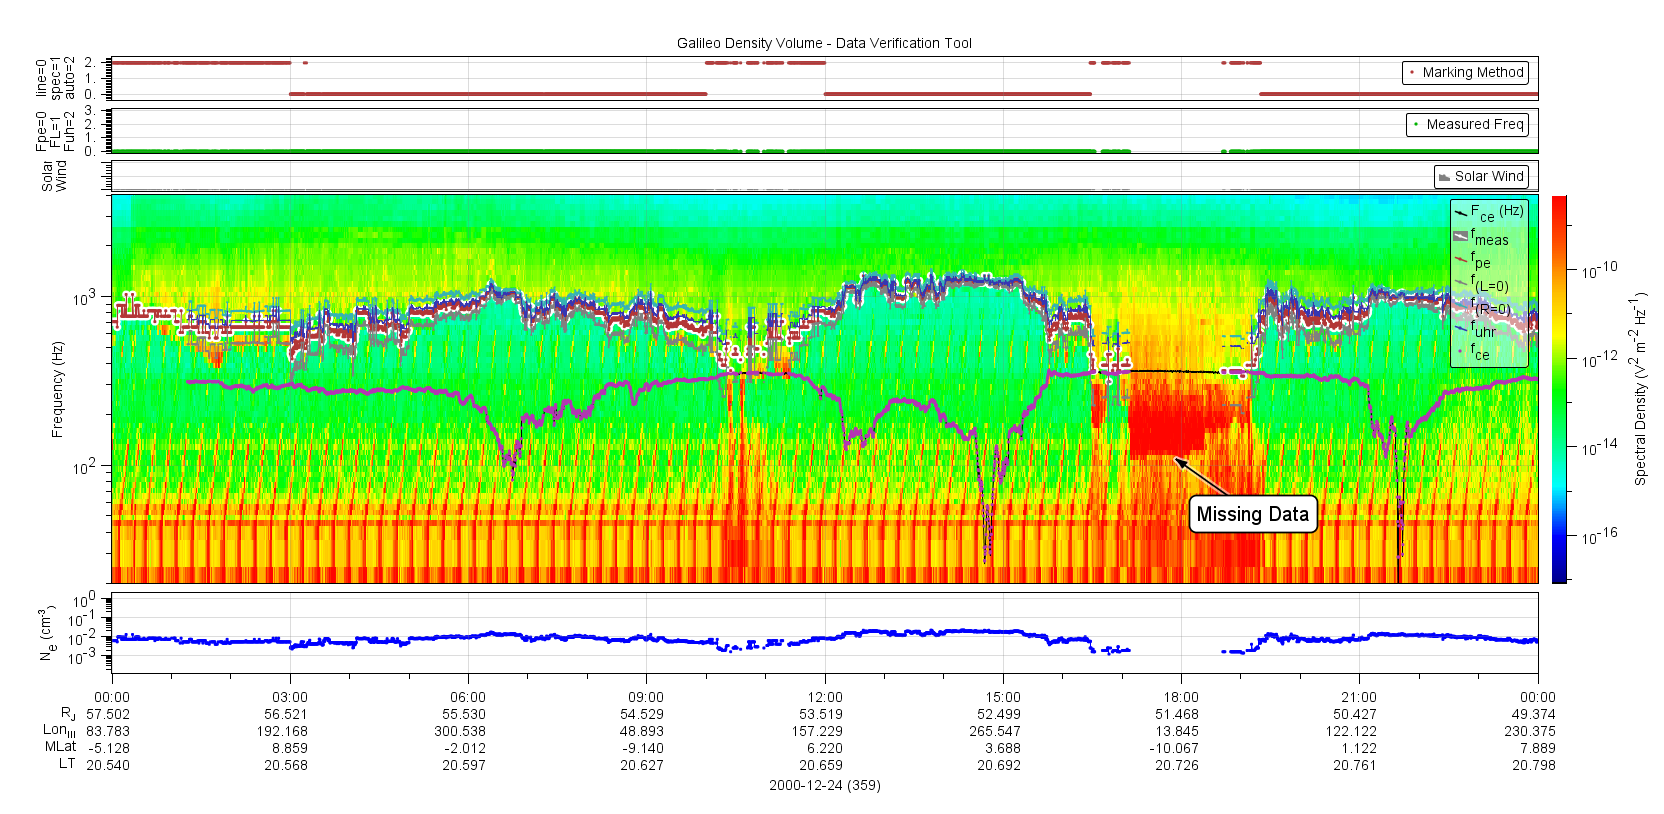
| 2000-359_a | Missing partial day densities | 2000-359 | Plot |
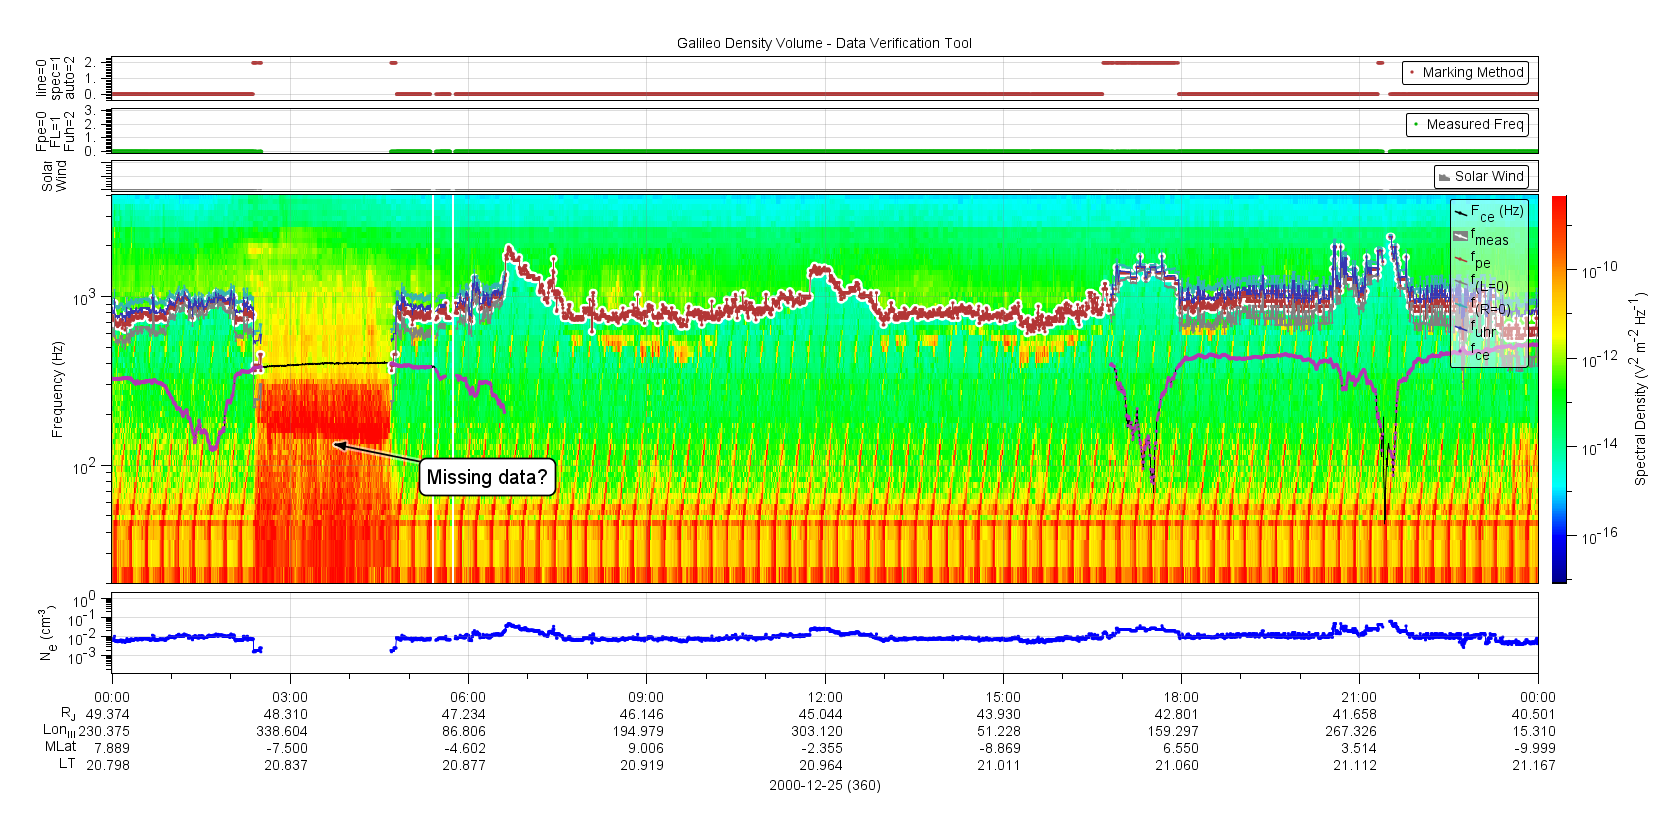
| 2000-360_a | Missing partial day densities | 2000-360 | Plot |
| 2000-361_a | Can't process input, Duplicate time values with different measurements and different frequency type designations |
2000-361 | |
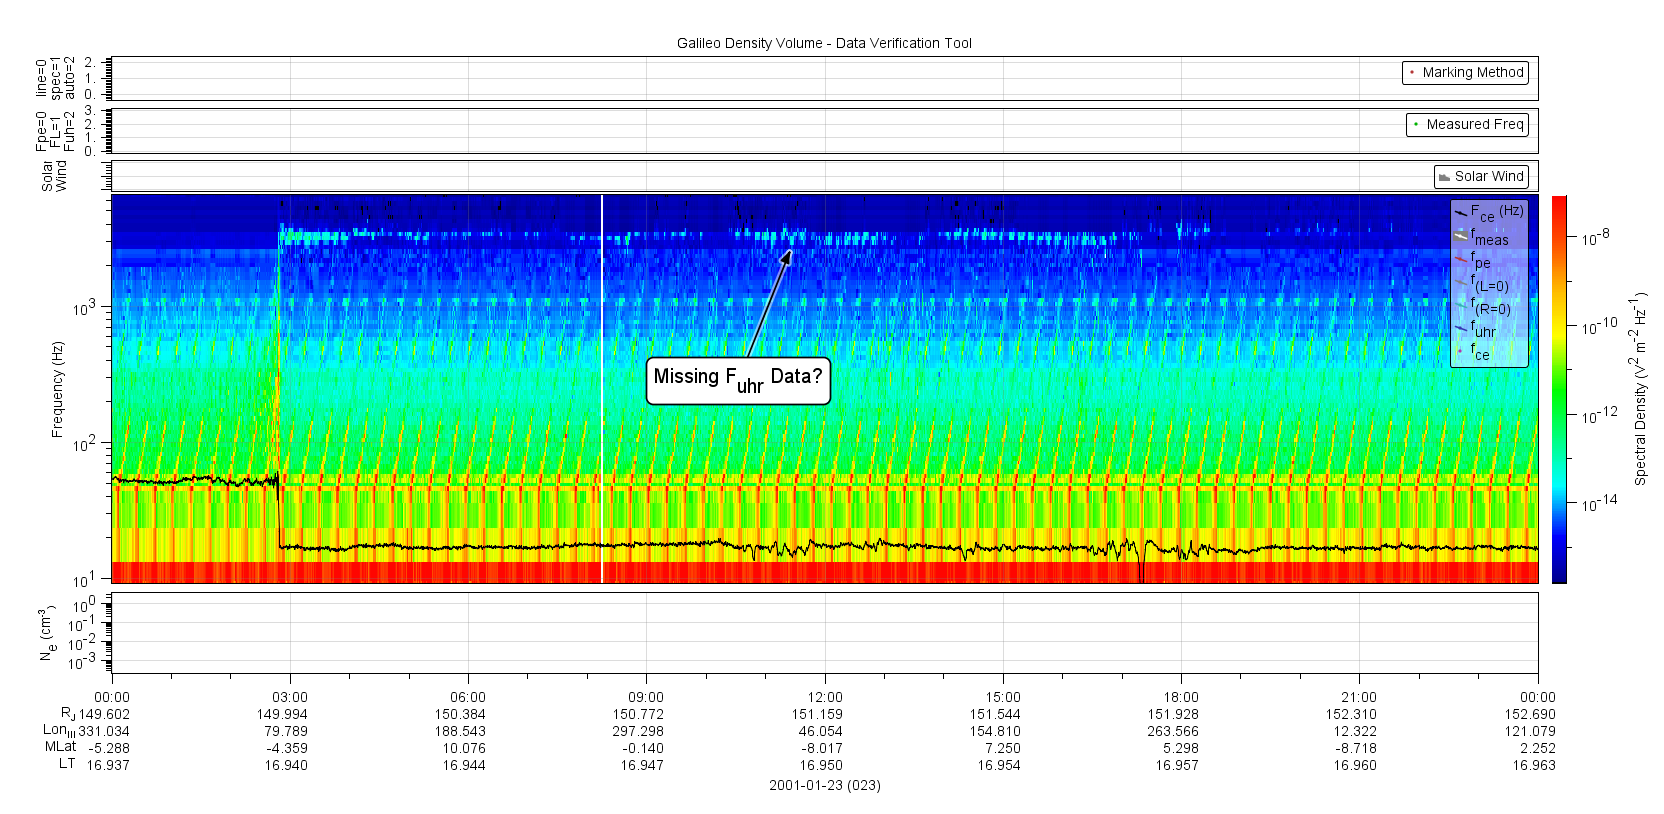
| 2001-023_a | Are we missing data? | 2001-023 | Plot |
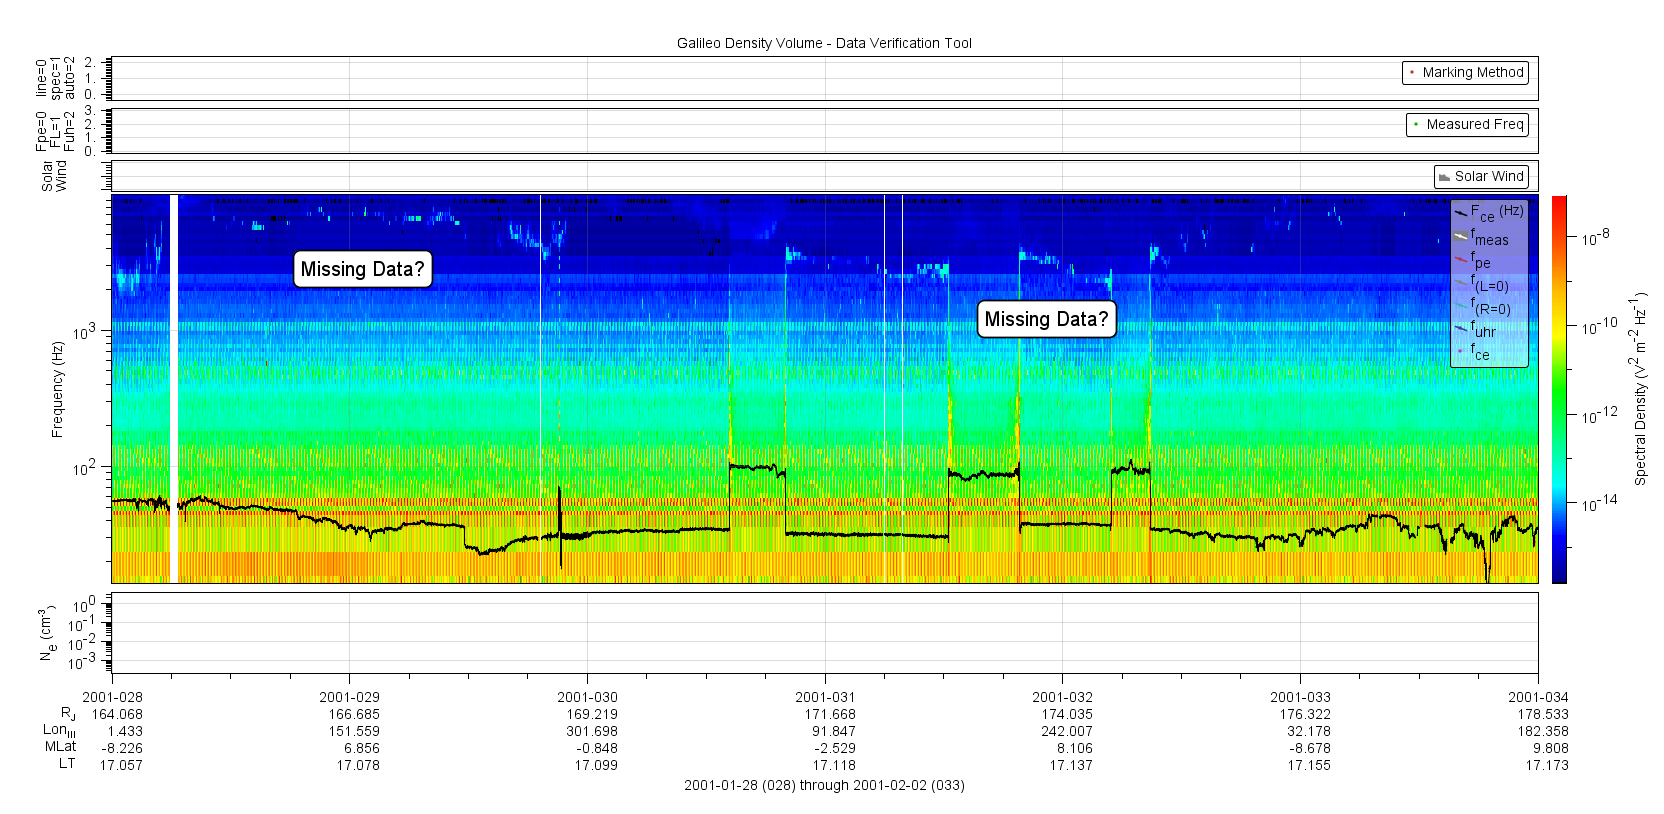
| 2001-028_a | Are we missing data (9 days)? | 2001-028 to 2001-037 | Plot |
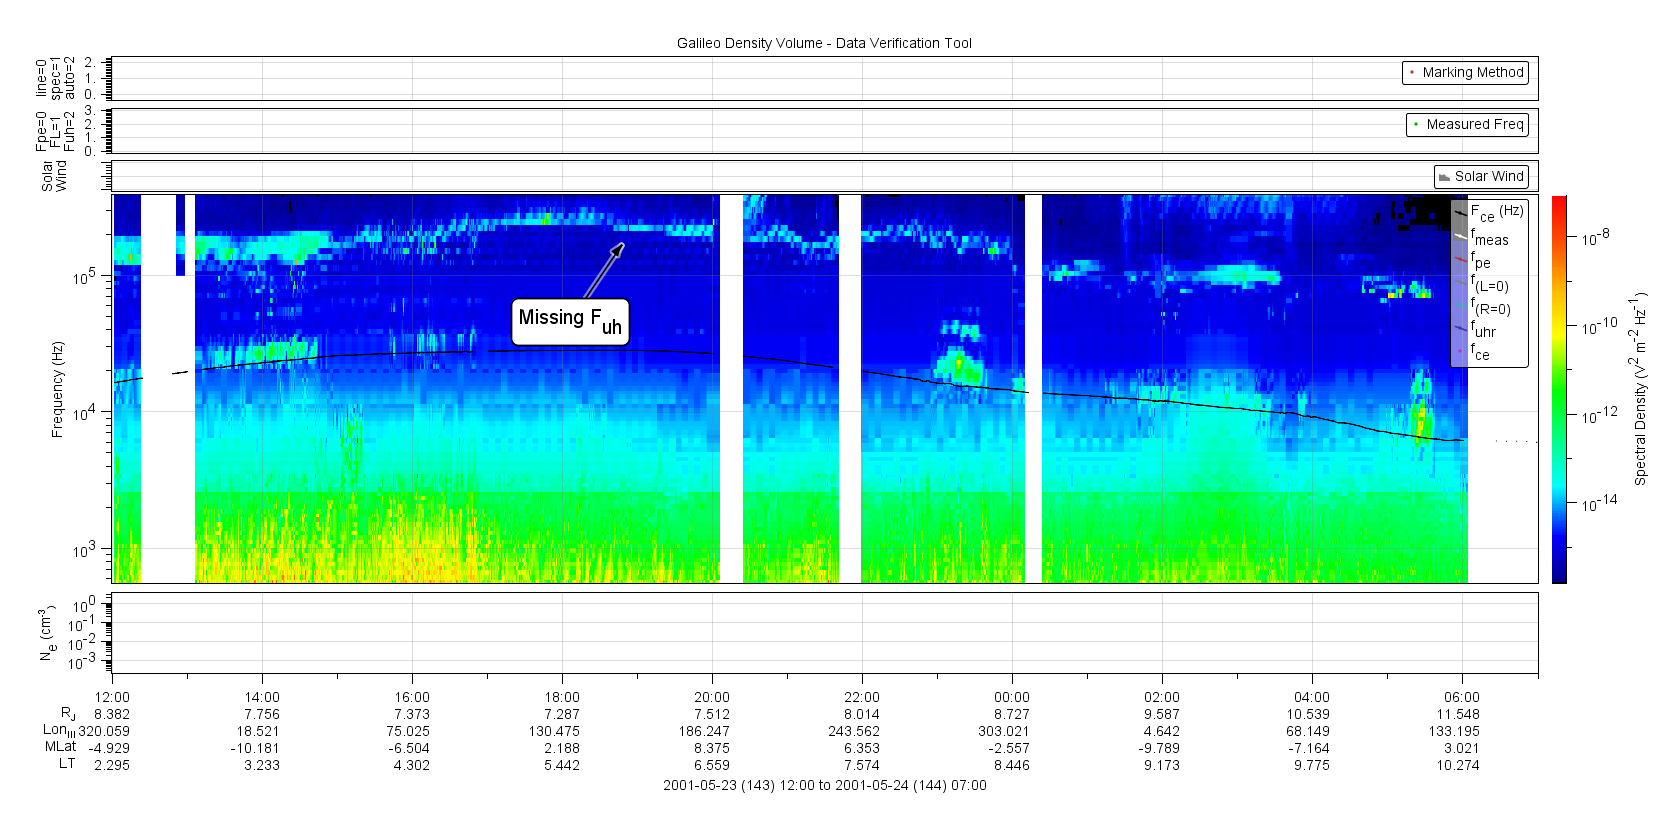
| 2001-143_a | Missing upper hybrid measurements (2 days) | 2001-143T12:00 to 2001-144T07:00 | Plot |
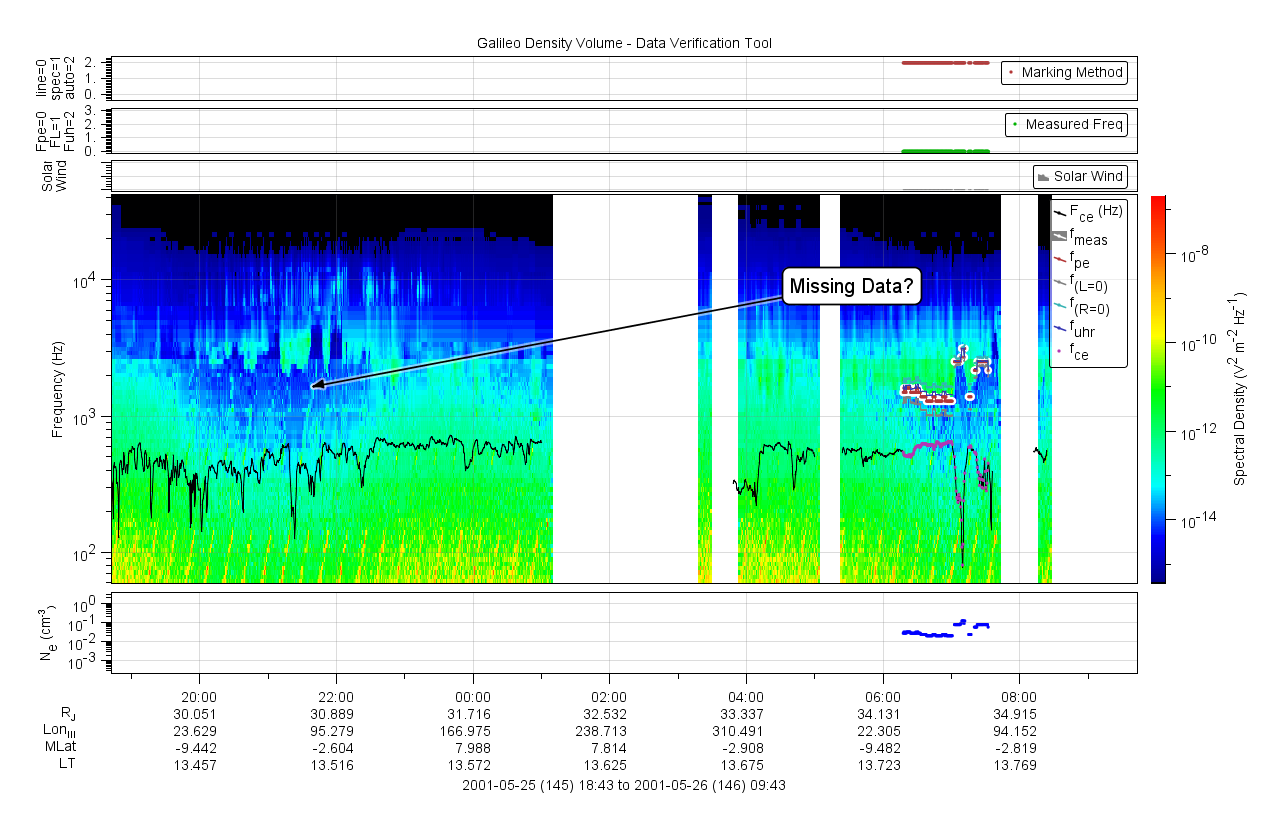
| 2001-145_a | Spectrum without densities | 2001-145 | Plot |
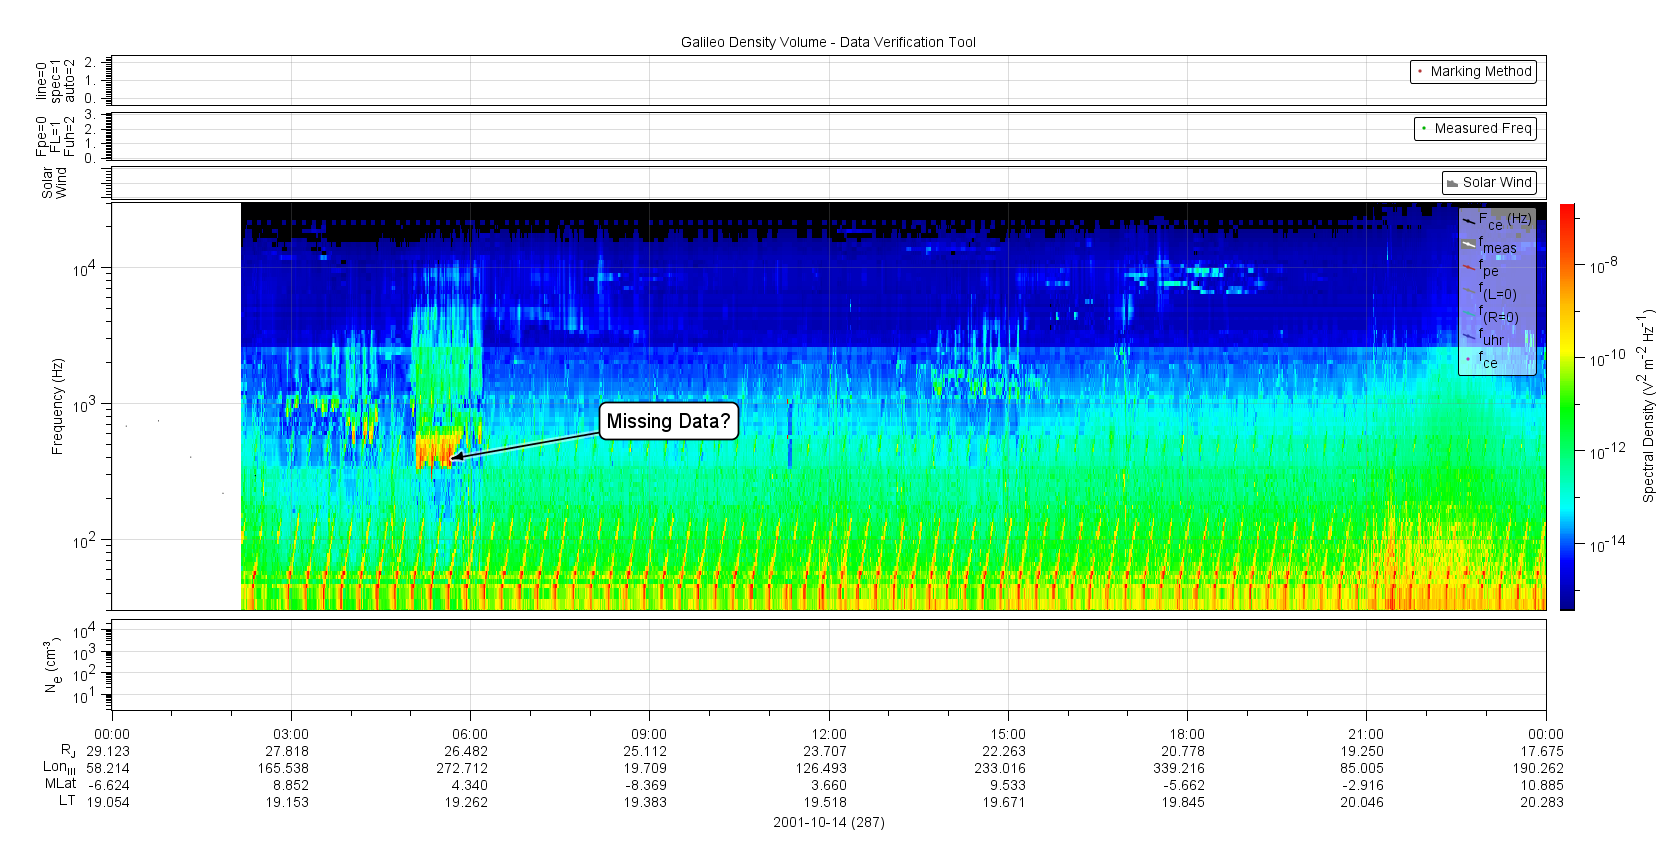
| 2001-287_a | Spectrum without densities | 2001-287 | Plot |
| 2002-004_a | Spectrum without densities | 2002-004 | |
| 2002-005_a | Spectrum without densities | 2002-005 | |
| 2002-006_a | Spectrum without densities | 2002-006 | |
| 2002-007_a | Spectrum without densities | 2002-007 | |
| 2002-008_a | Spectrum without densities | 2002-008 | |
| 2002-009_a | Spectrum without densities | 2002-009 | |
| 2002-010_a | Spectrum without densities | 2002-010 | |
| 2002-011_a | Spectrum without densities | 2002-011 | |
| 2002-012_a | Spectrum without densities | 2002-012 | |
| 2002-013_a | Spectrum without densities | 2002-013 | |
| 2002-014_a | Spectrum without densities | 2002-014 | |
| 2002-017_a | Spectrum without densities | 2002-017 | |
| 2002-018_a | Spectrum without densities | 2002-018 | |
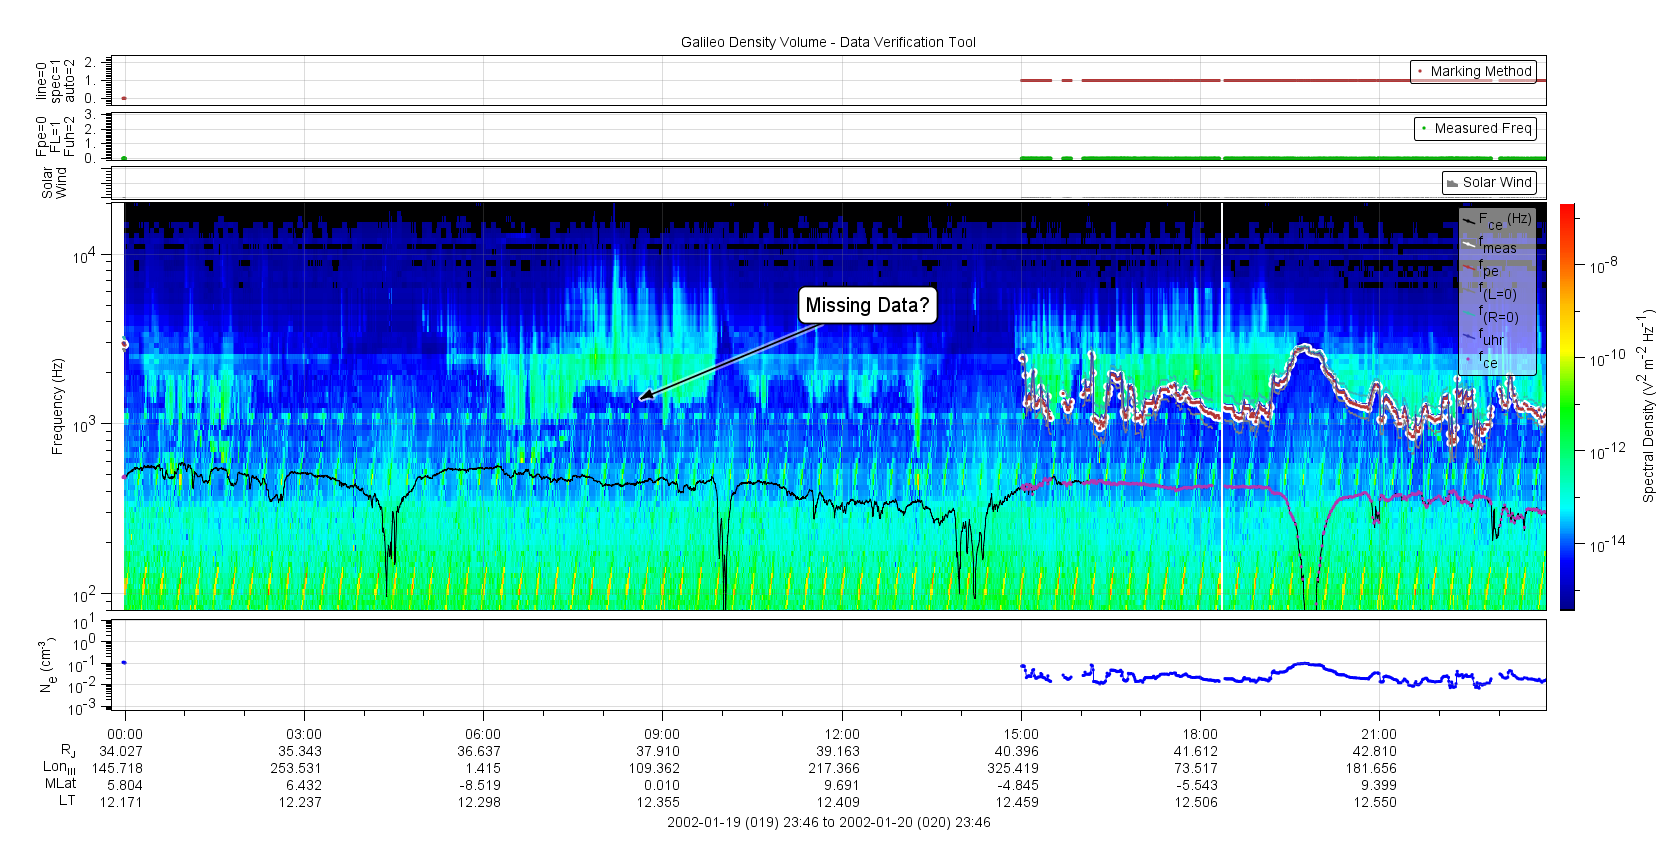
| 2002-020_a | Missing partial day densities | 2002-020 | Plot |
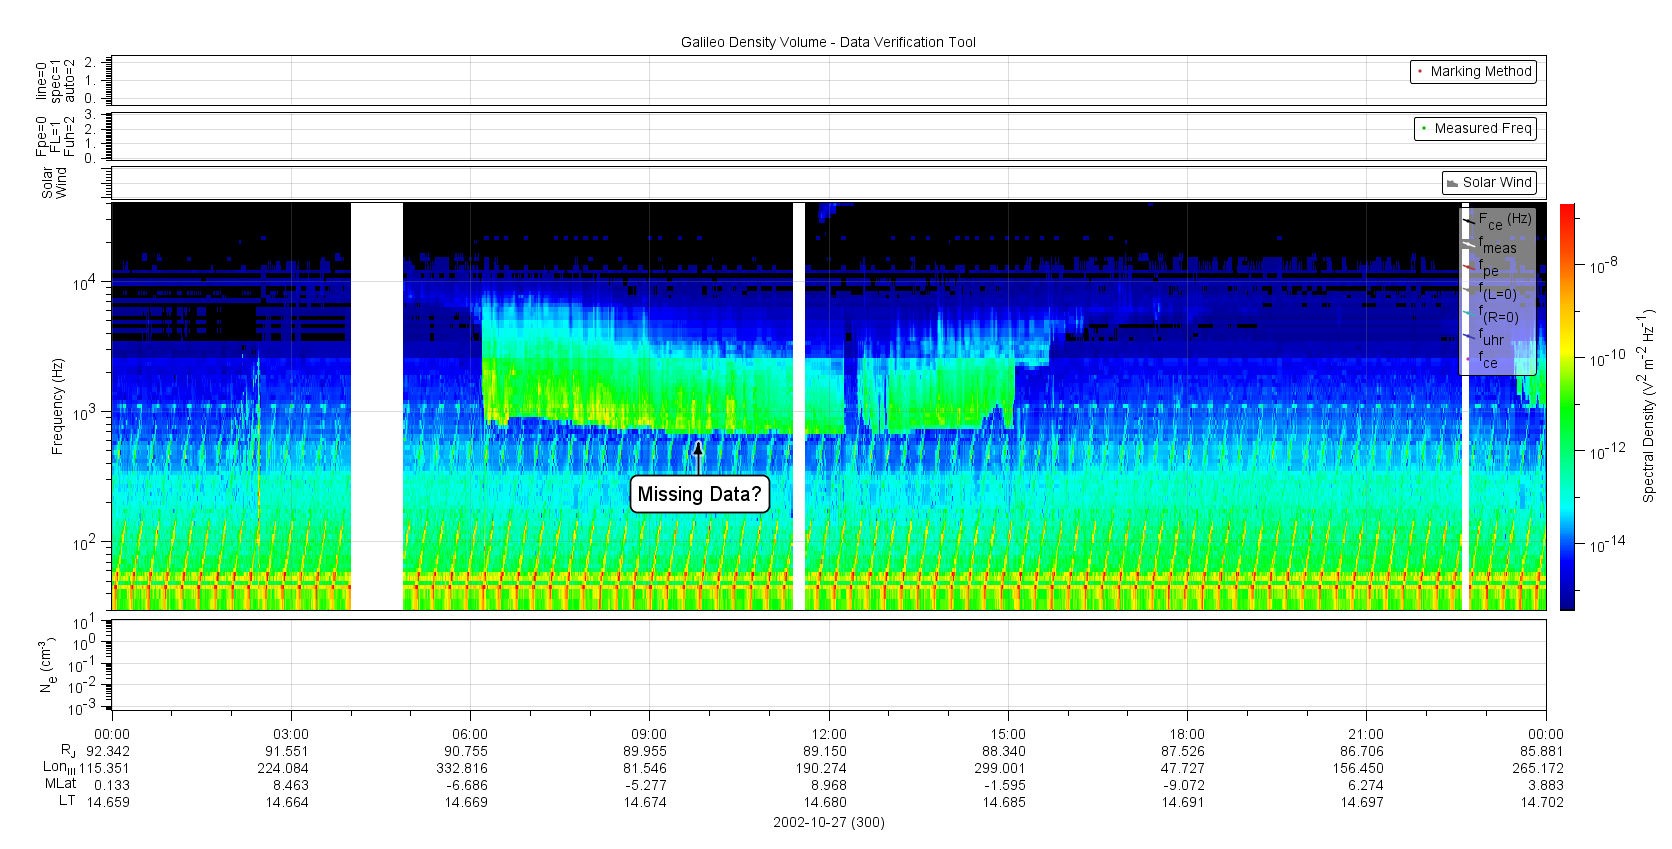
| 2002-300_a | Spectrum without densities | 2002-300 | Plot |
| 2002-301_a | Spectrum without densities | 2002-301 | |
| 2002-302_a | Spectrum without densities | 2002-302 | |
| 2002-303_a | Spectrum without densities | 2002-303 | |
| 2002-304_a | Spectrum without densities | 2002-304 | |
| 2002-305_a | Spectrum without densities | 2002-305 | |
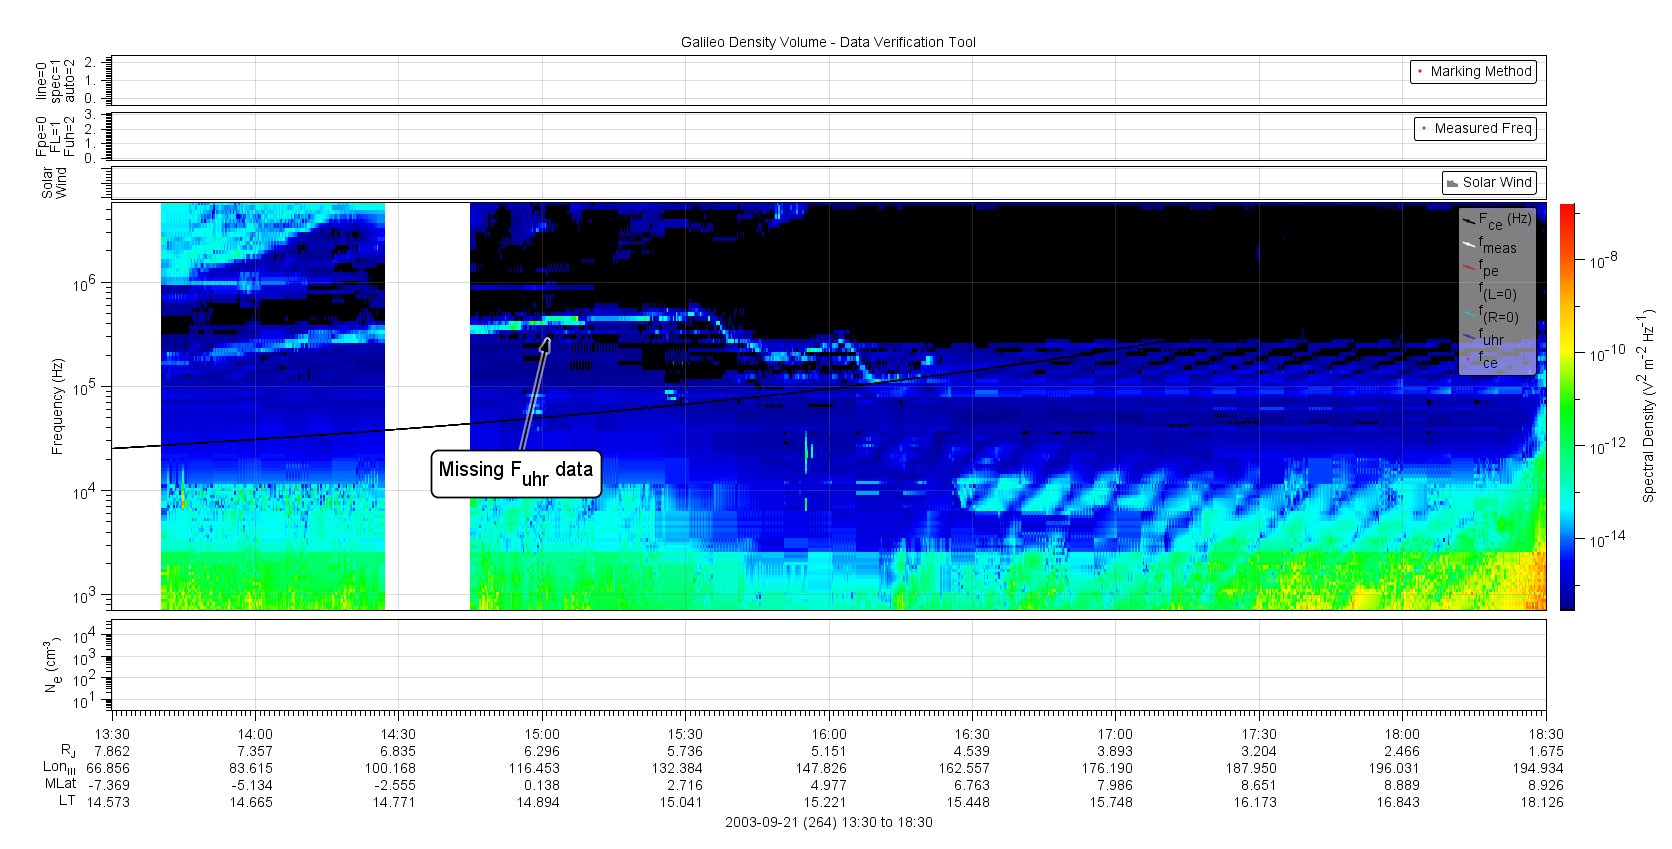
| 2003-264_a | Spectrum without densities | 2003-264 | Plot |
| ID | Problem | Resolution | Time Range | Plot |
|---|---|---|---|---|
| 1997-175_a | Densities without spectrum | 12 points deleted from FPE_1996_06_23_V01.CSV | 1997-175 16:00 to 16:30 | Plot1 Plot2 |
| 1996-256_a | Densities without spectrum | 9 points deleted from FPE_1996_09_12_V01.CSV | 1996-256 15:15 to 15:45 | Plot1 Plot2 |
| 1997-173_a | Densities without spectrum | 15 points deleted from FPE_1997_06_22_V01.CSV | 1997-06-22 16:30 to 17:00 | Plot1 Plot2 |
| 1997-182_a | Densities without spectrum | 7 points deleted from FPE_1997_07_01_V01.CSV | 1997-07-01 07:30 to 8:00 | Plot1 Plot2 |
| 1997-225_a | Densities without spectrum | 13 points deleted from FPE_1997_08_13_V01.CSV | 1997-08-13 15:45 to 16:15 | Plot1 Plot2 |
| 1997-228_a | Densities without spectrum | 14 points deleted from FPE_1997_08_17_V01.CSV | 1997-08-16T23:30 to 1997-08-17T00:30 | Plot1 Plot2 |
| 1997-233_a | Densities without spectrum | 7 points deleted from FPE_1997_08_21_V01.CSV | 1997-08-21 07:30 to 08:00 | Plot1 Plot2 |
| 1997-244_a | Densities without spectrum | 15 points deleted from FPE_1997_09_01_V01.CSV | 1997-09-01 10:45 to 12:00 | Plot1 Plot2 |
| 1997-257_a | Densities without spectrum | 21 points deleted from FPE_1997_09_14_V01.CSV | 1997-09-14 00:00 to 00:30 | Plot1 Plot2 |
| 1997-260_b | Possible bad data | 8 pts deleted from FPE_1997_09_17_V01.CSV | 1997-260 14:00 to 15:00 | Plot |
| 1997-263_a | Densities without spectrum | Brad seems to have removed bad points during this time period | 1997-09-20 17:45 to 18:15 | Plot1 Plot2 |
| 1998-329_a | Possible bad data | Brad seems to have removed bad points during this time period | 1998-329 08:30 to 09:00 | Plot |
| 1998-329_b | Possible bad data | Brad re-digitized this region | 1998-329 14:00 to 15:00 | Plot |
| 1998-329_c | Possible bad data | Brad re-digitized this region | 1998-329 19:00 to 20:00 | Plot |
| 1998-329_d | Possible bad data | Brad re-digitized this region | 1998-329 20:00 to 21:00 | Plot |
| 1998-329_e | Possible bad data | Brad seems to have removed bad points during this time period | 1998-329 23:30 to 00:00 | Plot |
| 1998-331_a | Possible bad data | 9 points deleted from FPE_1998_11_27_V01.CSV | 1998-331 19:15 to 19:45 | Plot |
| 1998-335_a | Possible bad data | 7 points deleted from FPE_1998_12_01_V01.CSV | 1998-335 02:30 to 03:00 | Plot |
| 1998-335_b | Possible bad data | 8 points deleted from FPE_1998_12_01_V01.CSV | 1998-335 13:00 to 13:30 | Plot |
| 1998-335_c | Possible bad data | 9 points deleted from FPE_1998_12_01_V01.CSV | 1998-335 14:30 to 15:15 | Plot |
| 1998-341_a | Possible bad data | 8 points deleted from FPE_1998_12_07_V01.CSV | 1998-341 18:45 to 19:15 | Plot |
| 1998-357_a | Possible bad data | 8 points deleted from FPE_1998_12_23_V01.CSV | 1998-357 15:45 to 16:15 | Plot |
| 1998-362_a | Possible bad data | 8 points deleted from FPE_1998_12_28_V01.CSV | 1998-362 06:00 to 06:30 | Plot |
| 1998-362_b | Possible bad data | 8 points deleted from FPE_1998_12_28_V01.CSV | 1998-362 09:45 to 10:15 | Plot |
| 1999-125_a | Densities without spectrum | 95 points deleted from FPE_1999_05_05_V01.CSV | 1999-05-05 15:00 to 19:30 | Plot |
| 1999-303_a | Possible bad data | 1 point deleted from FPE_1999_10_30_V01.CSV | 1999-303 15:30 to 16:00 | Plot |