 GALILEO PLASMA WAVE INVESTIGATION: OBSERVATIONS AT GANYMEDE
 GALILEO PLASMA WAVE INVESTIGATION: OBSERVATIONS AT GANYMEDE
In the December 12, 1996 issue of Nature Galileo Plasma Wave observations are shown which provide evidence that Jupiter's moon Ganymede possesses its own magnetosphere. This page provides access to the data used in "Evidence of a Magnetosphere at Ganymede from Galileo Plasma Wave Observations" by D. A. Gurnett, W. S. Kurth, A. Roux, S. J. Bolton, and C. F. Kennel.

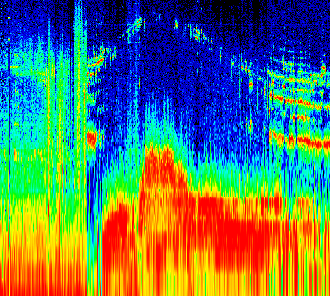
This Quicktime Movie (3.9MB) allows you to hear the plasma waves observed by the Galileo Plasma Wave Receiver as it flew past Ganymede. The image is a dynamic spectrogram showing the intensity of waves as a function of frequency (vertical axis) and time (horizontal axis) in which red indicates high intensity waves and blue indicates low intensities. This spectrogram was obtained by Fourier transforming the actual waveform from the electric antenna at a sample rate of 201,600 samples per second. We have used the same waveform to generate an audio signal but have used a sample rate of about a factor of 9 slower in order to shift the 80-kHz bandwidth down into the audio frequency range. We have also used a technique called time-slicing to reduce the 45-minute recording to just one minute. The cursor moves across the spectrogram as the audio signal is played.
We are grateful to Larry Granroth and Joe Groene at the University of Iowa for generating the spectrograms and sound files. Sugi Sorensen and Mike Martin of JPL's Data Distribution Lab kindly generated the Quicktime movie.