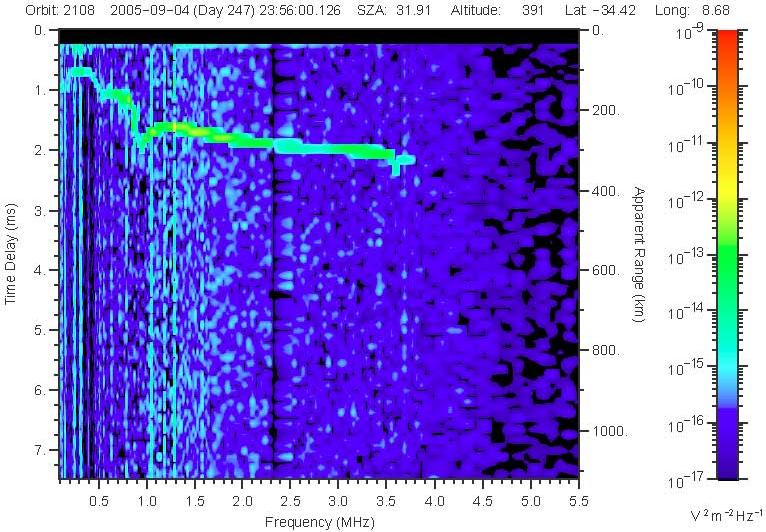
MARSIS data are analyzed using an ionogram, which plots the time delay of the
radar echo as a function of the frequency, color coded for amplitude. An
ionospheric radar echo appears as a trace exhibiting a smooth increase in time
delay with frequency and an intensity at least two orders of magnitude higher
than the background noise. As the frequency increases, this trace typically
displays an abrupt increase in time delay at some frequency, forming a
discontinuity in the trace that we call a "cusp". Cusps indicate locations of
maximums in the electron density as a function of altitude.
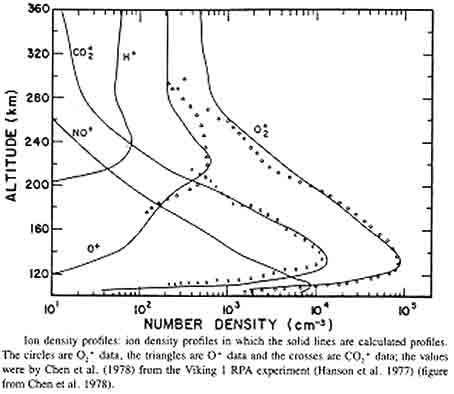
A rough estimate of the density profile can be obtained simply by using the apparent range to the reflection point; however, accurate measurements require correcting for dispersion in the ionospheric plasma. Since the time delay is known, the altitude as a function of the plasma frequency and, by conversion, the altitude as a function of the density can be computed for an assumed horizontally stratified ionosphere. Our approach to finding a density profile was to use a theoretical model and then adjust the parameters to give the best overall fit to the measurements. For a density model, we used the Chapman model from his 1931 paper. This fit yields the maximum density of the ionospheric layer, as well as the altitude at which this density occurs. Previous analysis has shown that the main Martian ionospheric layer has a cusp corresponding to a peak electron density of about 10^5 cm^-3 at an altitude of about 130 km, consistent with the results from the Viking landers of the 1970s showing that this main layer is primarily composed of O2+ and CO2+ ions. A summary of the results of the analysis of the main layer are published in a paper by Gurnett, et al (2005), and a new paper, with updated results and new findings, is in press and will be published in Advances in Space Research. |
|
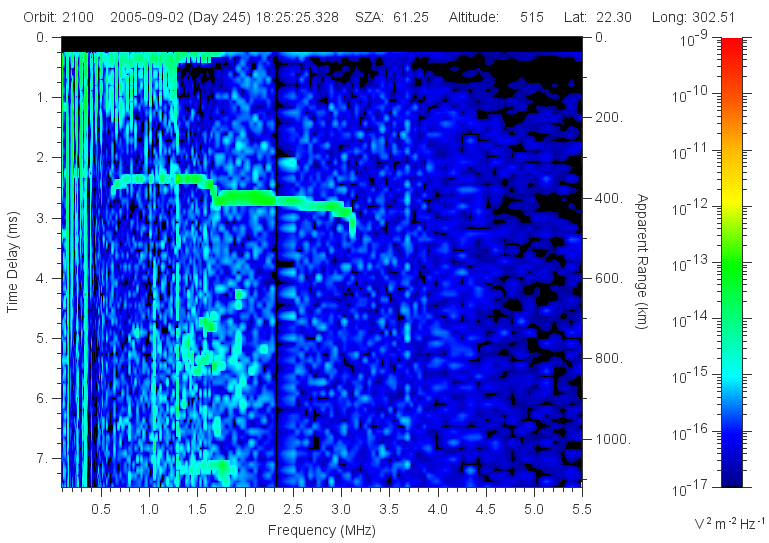
Most MARSIS ionograms display a cusp at the maximum plasma frequency of the main
layer of the ionosphere. However, MARSIS ionograms have also commonly shown an
additional cusp at a higher altitude, indicating the presence of a new
distinct layer higher in the topside ionosphere. Analysis similar to that of the main
layer was performed in order to ascertain the properties of this feature, most
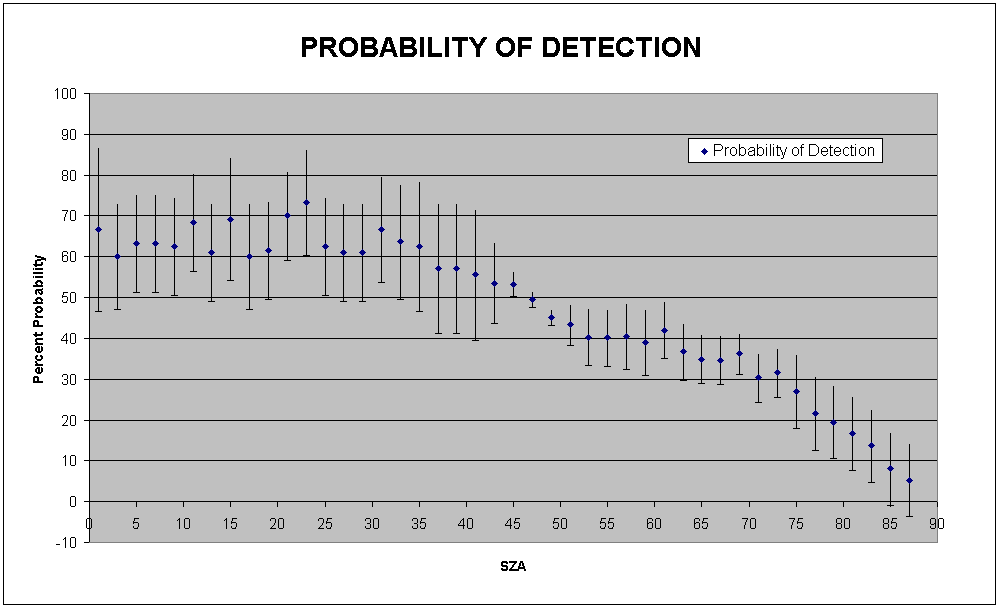
notably at what density and altitude the discontinuity occurred. Analysis has been completed on roughly 1500 ionograms resulting from more than 50 orbits of the planet. This study indicates that the peak density of this layer is typically around 5 x 10^4 cm^-3 at an altitude above 200 km, though it has been observed as high as 235 km. While this feature is not seen in every ionogram, detection has been made at many locations in the planet's ionosphere at various spacecraft altitudes. In addition, it has shown no clear indication of any time dependence, implying that the presence of this layer is likely a normal part of the Martian ionosphere and not simply due to transient variations in the solar UV flux. |
![]() |
This feature was originally theorized to be a distinct upper layer of the
ionosphere dominated by a peaking density of O+ ions, and this idea remains the
leading candidate among all considered explanations. These ions had been
detected by
the Viking landers to peak in the 200-250 km range and become significant in
respect to the dominant ions of the main layer at higher altitudes.
Results of our analysis support the possibility of a layered ionosphere,
and the altitude of this feature corresponds well with the Viking detection of
O+ ions. However, the density of these ions measured by the Viking probes would
seem to imply they are not populous enough to produce the observed effect.
It should be noted, however, that the descending Viking landers only provided
two direct measurements, both at solar minimum. MARSIS, meanwhile, has produced
many thousands of data sets, a surprising number of which have shown this clear
second peak in the ionospheric density. The altitude of this layer's peak density, however, does raise other questions. It is rather well established that the departure from photochemical equilibrium to transport domination takes place near 200 km on the dayside of the Mars ionosphere. As a result, solar wind interaction may also be a key factor in the observance of this feature. The solar wind could play one of two roles. First, the presence of energetic electrons in the wind could act to further ionize the ionosphere at this layer, causing the sudden change in density and slope of the reflection that is observed on the ionogram. In addition, the solar wind could cause a dynamical effect, transporting parts of the ionosphere horizontally along the planet, and eventually away from Mars, which could contribute to the detected atmospheric loss occurring at Mars. In any case, solar interaction appears to play a role, as the detection of this feature has proven to be dependent upon the solar zenith angle. This explanation may be the most probable; however, the lack of consistent detection raises questions on the origins and stability of this layer. |
![]() |
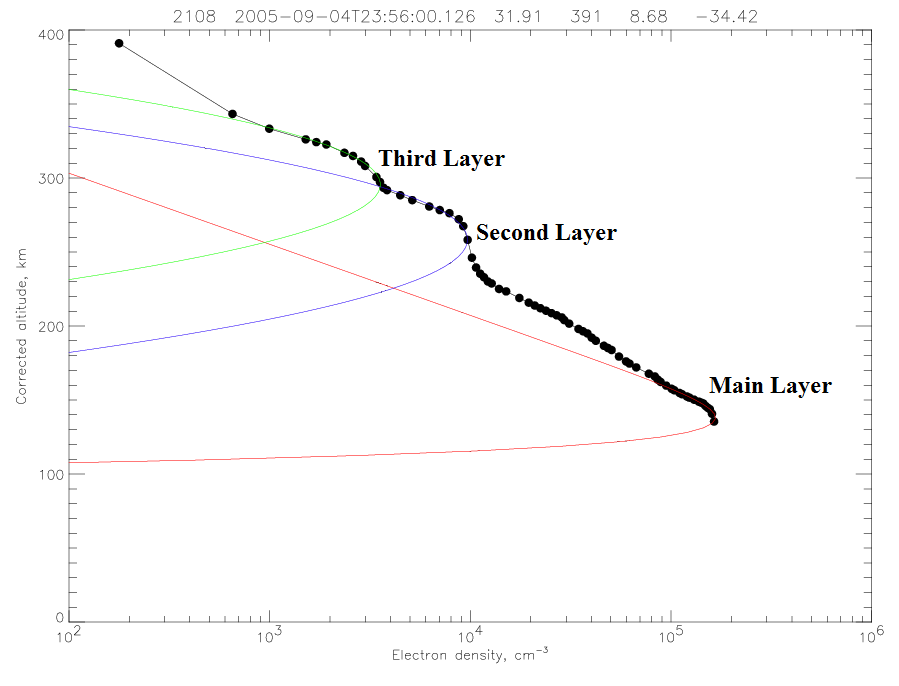
Attempts to explain this feature have been further confounded by the occasional detection of a similar feature even higher in the ionosphere. In ideal observations, where interference at the lower frequencies is minimized, it has proven possible to identify a third cusp in the ionospheric trace, indicating another location where a critical point occurs in the density profile. This feature appears at an altitude of just under 300 km, and has an electron density of only about 3 x 10^3 cm^-3. The combined effect of instrumentation limits and low density easily account for the sparse detection of this feature. However, since this feature is also believed to be a real feature of the Martian ionosphere, any model explaining the cusp near 200 km should also allow for this higher cusp as well. |
![]() |
The present focus of our research on this feature has two objectives. First,
since any upper layers lie outside of photochemical equilibrium, they can not be
described by a Chapman model. As a result, we are presently working on fitting
the data to more generic functions and models that do not violate the physical
conditions found at Mars. An example of this style of fitting can be seen at
the right. This more realistic approach will allow us to better calculate the
properties of the ionosphere in these upper regions, including the altitude of
the peaks in density and also the total electron content. In addition, we are attempting to recreate the type of density profiles observed by MARSIS through computer simulation and modeling. We are presently working with a basic three species model using CO2+, O2+, and O+, utilizing the primary photochemical reaction equations that occur in the Martian ionosphere to attempt to recreate the data we have measure with MARSIS, most notably the second peak at the higher altitude. This process has only just begun, so no comparable result has yet been produced, though there is much left to do on this effort. |
![]() |